Nutritional Risk Screening Tools for Older Adults with COVID-19: A Systematic Review

 , ,
, ,  and
and
Abstract
:1. Introduction
2. Materials and Methods
2.1. Eligibility Criteria
2.2. Databases and Search Strategy
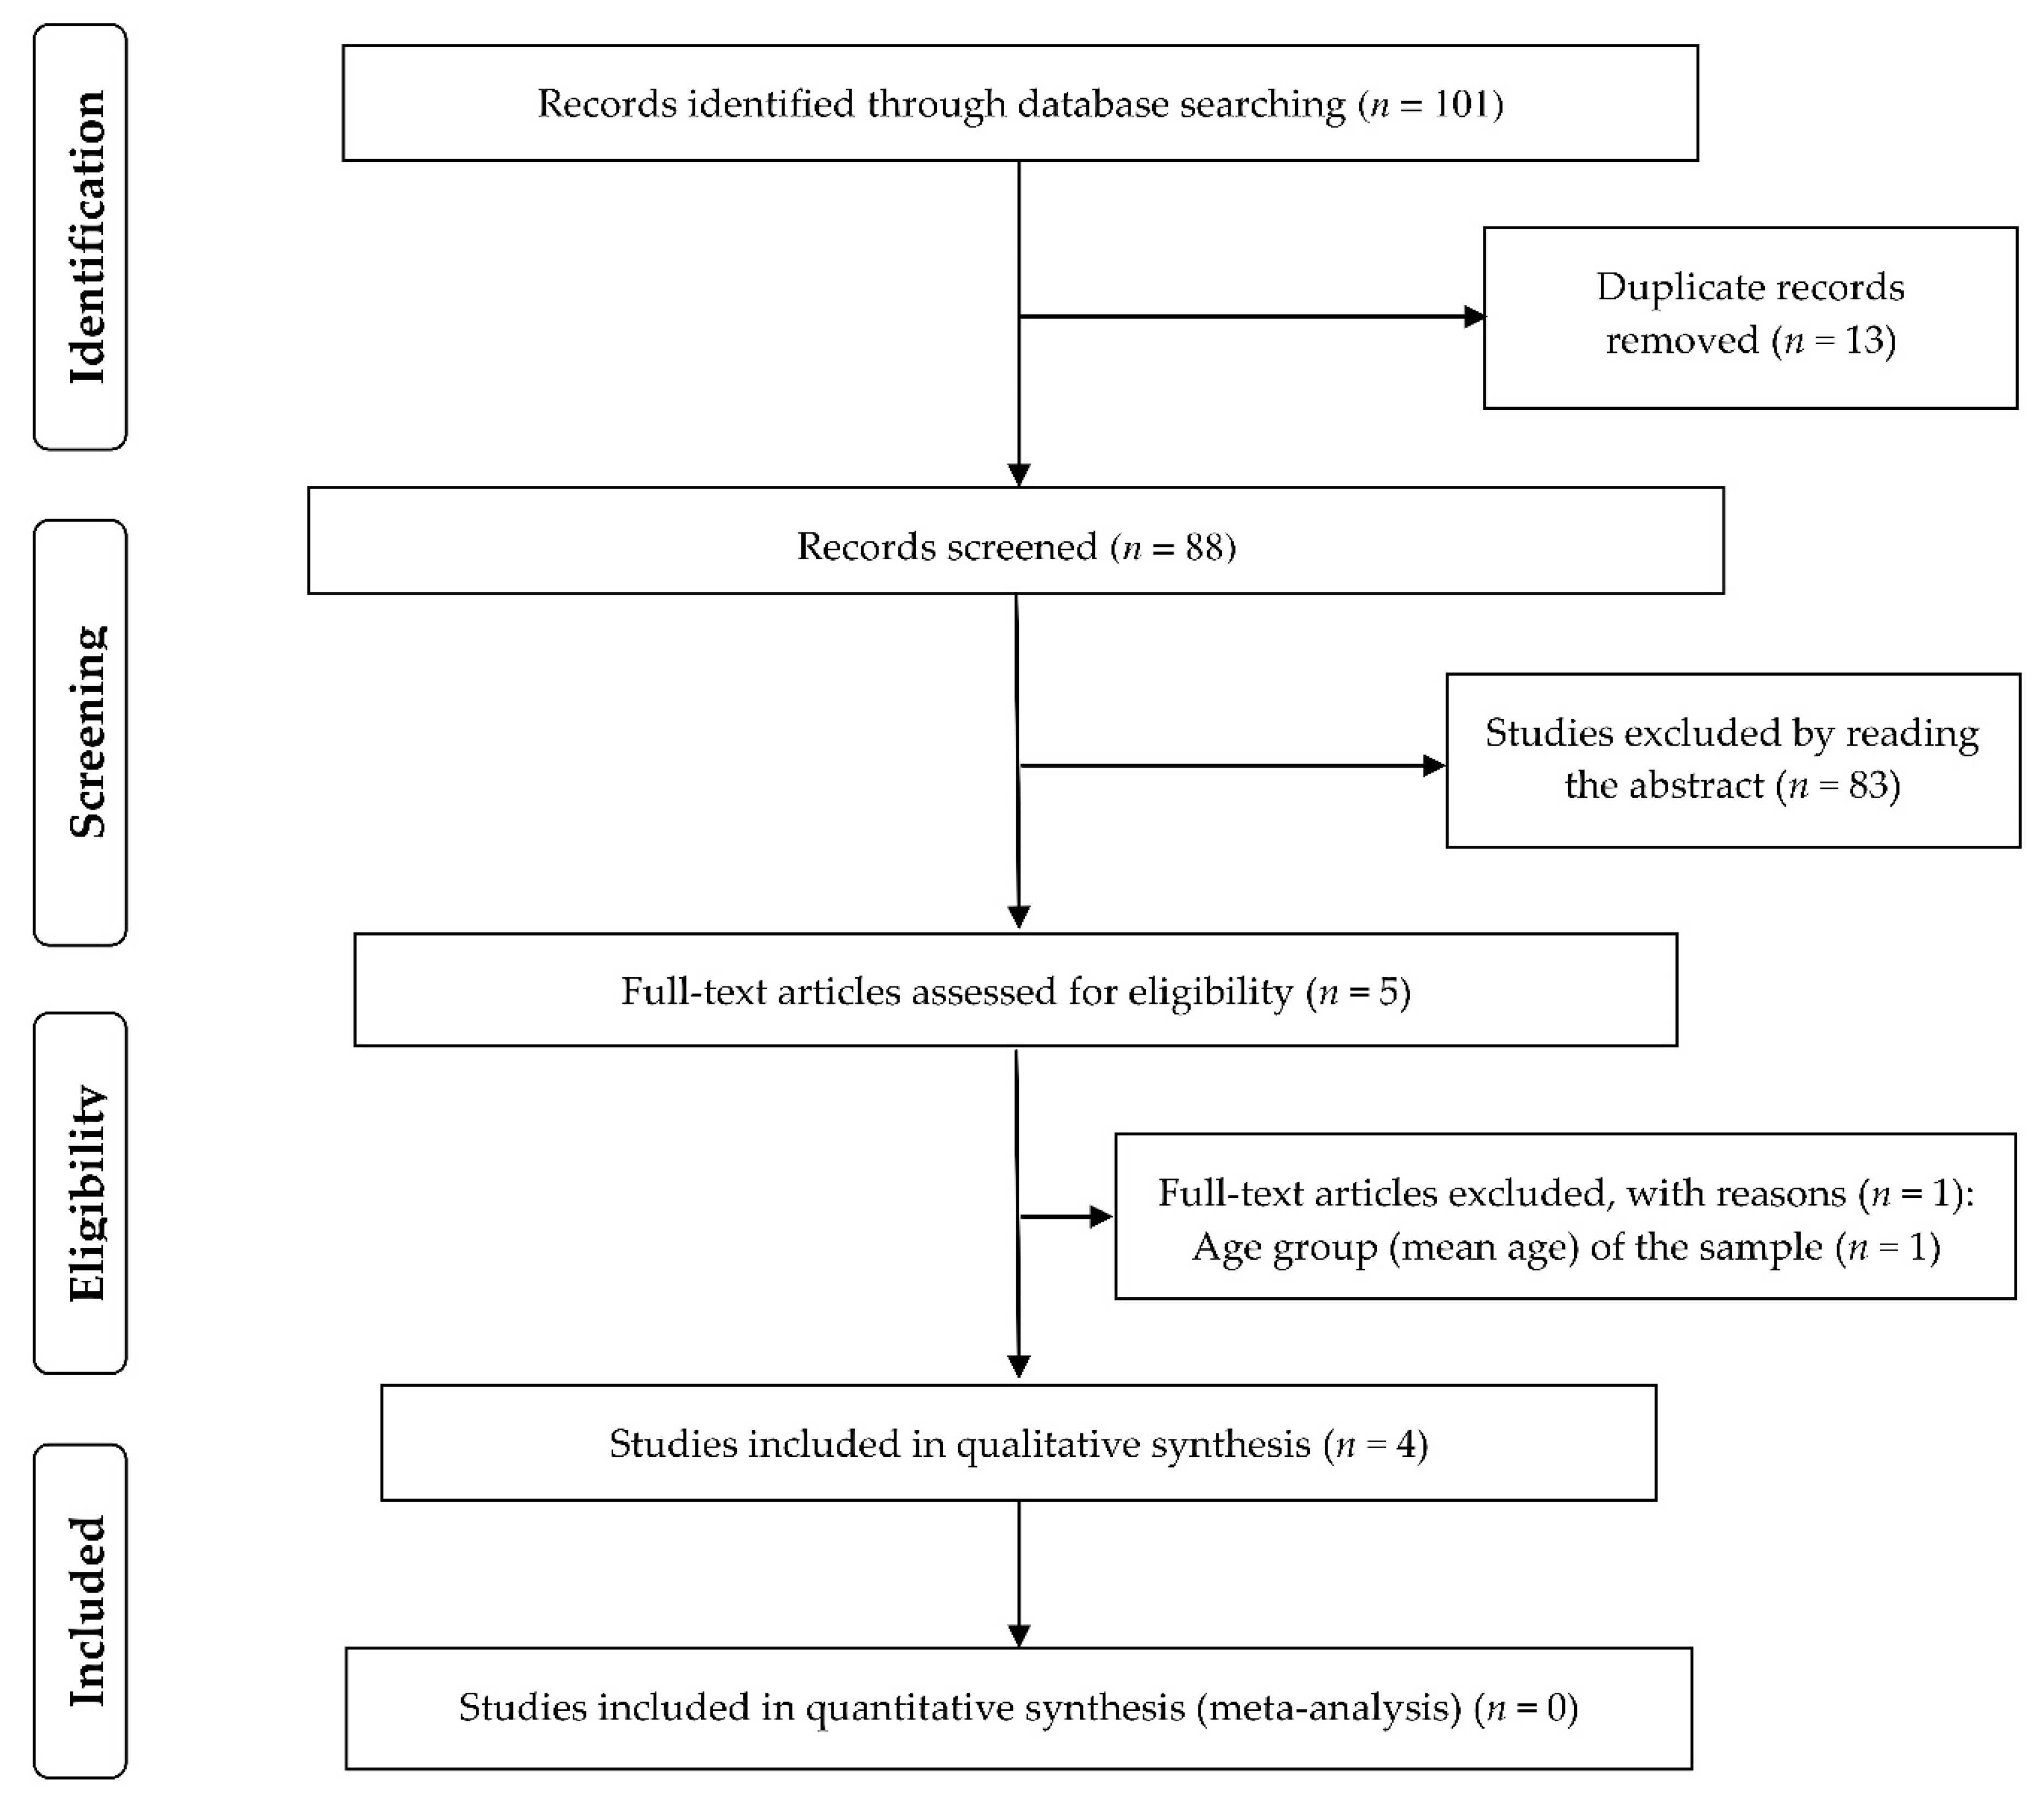
2.3. Screening and Selection of Studies
2.4. Data Extraction
2.5. Evaluation of Studies’ Methodological Quality and Instruments’ Properties
2.6. Narrative Summary of Results
3. Results
3.1. Methodological Quality of Studies
3.2. Participants’ Characteristics
3.3. COVID-19 Diagnosis Method
3.4. Nutritional Screening Instruments Used to Identify Nutritional Risk
3.5. Nutritional Risk in Older Adults with COVID-19
3.6. Association between Comorbidities and Nutritional Risk
3.7. Sensitivity, Specificity, and Criterion Validity of Nutritional Screening Instruments
3.8. Predictive Validity of Screening and Nutritional Assessment Instruments
4. Discussion
5. Conclusions
Supplementary Materials
Author Contributions
Funding
Conflicts of Interest
References
- World Health Organization. Coronavirus Disease 2019 (COVID-19). Situation Report—206. Available online: https://www.who.int/docs/default-source/coronaviruse/situation-reports/20200813-covid-19-sitrep-206.pdf?sfvrsn=bf38f66b_6 (accessed on 14 August 2020).
- Zheng, Z.; Peng, F.; Xu, B.; Zhao, J.; Liu, H.; Peng, J.; Li, Q.; Jiang, C.; Zhou, Y.; Liu, S.; et al. Risk factors of critical & mortal COVID-19 cases: A systematic literature review and meta-analysis. J. Infect. 2020, 81, e16–e25. [Google Scholar] [CrossRef] [PubMed]
- Fu, L.; Wang, B.; Yuan, T.; Chen, X.; Ao, Y.; Fitzpatrick, T.; Li, P.; Zhou, Y.; Lin, Y.F.; Duan, Q.; et al. Clinical characteristics of coronavirus disease 2019 (COVID-19) in China: A systematic review and meta-analysis. J. Infect. 2020, 80, 656–665. [Google Scholar] [CrossRef] [PubMed]
- Liu, K.; Chen, Y.; Lin, R.; Han, K. Clinical features of COVID-19 in elderly patients: A comparison with young and middle-aged patients. J. Infect. 2020, 80, e14–e18. [Google Scholar] [CrossRef] [PubMed] [Green Version]
- Mehta, P.; McAuley, D.F.; Brown, M.; Sanchez, E.; Tattersall, R.S.; Manson, J.J. HLH Across Speciality Collaboration. COVID-19: Consider cytokine storm syndromes and immunosuppression. Lancet 2020, 395, 1033–1034. [Google Scholar] [CrossRef]
- Zabetakis, I.; Lordan, R.; Norton, C.; Tsoupras, A. COVID-19: The Inflammation Link and the Role of Nutrition in Potential Mitigation. Nutrients 2020, 12, 1466. [Google Scholar] [CrossRef] [PubMed]
- Handu, D.; Moloney, L.; Rozga, M.; Cheng, F. Malnutrition Care during the COVID-19 Pandemic: Considerations for Registered Dietitian Nutritionists Evidence Analysis Center. J. Acad. Nutr. Diet. 2020, in press. [Google Scholar] [CrossRef]
- Lochs, H.; Allison, S.P.; Meier, R.; Pirlich, M.; Kondrup, J.; van den Berghe, G.; Pichard, C. Introductory to the ESPEN guidelines on enteral nutrition: Terminology, definitions and general topics. Clin. Nutr. 2006, 25, 180–186. [Google Scholar] [CrossRef] [Green Version]
- Dent, E.; Hoogendijk, E.O.; Visvanathan, R.; Wright, O. Malnutrition Screening and Assessment in Hospitalised Older People: A Review. J. Nutr. Health Aging. 2019, 23, 431–441. [Google Scholar] [CrossRef]
- Cereda, E.; Veronese, N.; Caccialanza, R. The final word on nutritional screening and assessment in older persons. Curr. Opin. Clin. Nutr. Metab. Care 2018, 21, 24–29. [Google Scholar] [CrossRef]
- Rubenstein, L.Z.; Harker, J.O.; Salvà, A.; Guigoz, Y.; Vellas, B. Screening for undernutrition in geriatric practice: Developing the short-form mini-nutritional assessment (MNA-SF). J. Gerontol. A Biol. Sci. Med. Sci. 2001, 56, M366–M372. [Google Scholar] [CrossRef] [Green Version]
- Kaiser, M.J.; Bauer, J.M.; Ramsch, C.; Uter, W.; Guigoz, Y.; Cederholm, T.; Thomas, D.R.; Anthony, P.; Charlton, K.E.; Maggio, M.; et al. MNA-International Group Validation of the Mini Nutritional Assessment short-form (MNA-SF): A practical tool for identification of nutritional status. J. Nutr. Health Aging 2009, 13, 782–788. [Google Scholar] [CrossRef] [PubMed]
- Bouillanne, O.; Morineau, G.; Dupont, C.; Coulombel, I.; Vincent, J.P.; Nicolis, I.; Benazeth, S.; Cynober, L.; Aussel, C. Geriatric Nutritional Risk Index: A new index for evaluating at-risk elderly medical patients. Am. J. Clin. Nutr. 2005, 82, 777–783. [Google Scholar] [CrossRef] [PubMed] [Green Version]
- Kondrup, J.; Rasmussen, H.H.; Hamberg, O.; Stanga, Z.; Ad Hoc ESPEN Working Group. Nutritional risk screening (NRS 2002): A new method based on an analysis of controlled clinical trials. Clin. Nutr. 2003, 22, 321–336. [Google Scholar] [CrossRef]
- Stratton, R.J.; Hackston, A.; Longmore, D.; Dixon, R.; Price, S.; Stroud, M.; King, C.; Elia, M. Malnutrition in hospital outpatients and inpatients: Prevalence, concurrent validity and ease of use of the ‘malnutrition universal screening tool’ (‘MUST’) for adults. Br. J. Nutr. 2004, 92, 799–808. [Google Scholar] [CrossRef]
- Buzby, G.P.; Williford, W.O.; Peterson, O.L.; Crosby, L.O.; Page, C.P.; Reinhardt, G.F.; Mullen, J.L. A randomized clinical trial of total parenteral nutrition in malnourished surgical patients: The rationale and impact of previous clinical trials and pilot study on protocol design. Am. J. Clin. Nutr. 1988, 47, 357–365. [Google Scholar] [CrossRef] [PubMed]
- Kruizenga, H.M.; Seidell, J.C.; de Vet, H.C.; Wierdsma, N.J. Development and validation of a hospital screening tool for malnutrition: The short nutritional assessment questionnaire (SNAQ). Clin. Nutr. 2005, 24, 75–82. [Google Scholar] [CrossRef]
- Heyland, D.K.; Dhaliwal, R.; Jiang, X.; Day, A.G. Identifying critically ill patients who benefit the most from nutrition therapy: The development and initial validation of a novel risk assessment tool. Crit. Care 2011, 15, R268. [Google Scholar] [CrossRef] [Green Version]
- Vellas, B.; Villars, H.; Abellan, G.; Soto, M.E.; Rolland, Y.; Guigoz, Y.; Morley, J.E.; Chumlea, W.; Salva, A.; Rubenstein, L.Z.; et al. Overview of the MNA--Its history and challenges. J. Nutr. Health Aging 2006, 10, 456–465. [Google Scholar]
- Cereda, E.; Pedrolli, C.; Klersy, C.; Bonardi, C.; Quarleri, L.; Cappello, S.; Turri, A.; Rondanelli, M.; Caccialanza, R. Nutritional status in older persons according to healthcare setting: A systematic review and meta-analysis of prevalence data using MNA®. Clin. Nutr. 2016, 35, 1282–1290. [Google Scholar] [CrossRef]
- Poulia, K.A.; Yannakoulia, M.; Karageorgou, D.; Gamaletsou, M.; Panagiotakos, D.B.; Sipsas, N.V.; Zampelas, A. Evaluation of the efficacy of six nutritional screening tools to predict malnutrition in the elderly. Clin. Nutr. 2012, 31, 378–385. [Google Scholar] [CrossRef]
- Detsky, A.S.; McLaughlin, J.R.; Baker, J.P.; Johnston, N.; Whittaker, S.; Mendelson, R.A.; Jeejeebhoy, K.N. What is subjective global assessment of nutritional status? JPEN J. Parenter. Enter. Nutr. 1987, 11, 8–13. [Google Scholar] [CrossRef] [PubMed] [Green Version]
- Leij-Halfwerk, S.; Verwijs, M.H.; van Houdt, S.; Borkent, J.W.; Guaitoli, P.R.; Pelgrim, T.; Heymans, M.W.; Power, L.; Visser, M.; Corish, C.A.; et al. Prevalence of protein-energy malnutrition risk in European older adults in community, residential and hospital settings, according to 22 malnutrition screening tools validated for use in adults ≥ 65 years: A systematic review and meta-analysis. Maturitas 2019, 126, 80–89. [Google Scholar] [CrossRef] [PubMed]
- Sheean, P.M.; Peterson, S.J.; Chen, Y.; Liu, D.; Lateef, O.; Braunschweig, C.A. Utilizing multiple methods to classify malnutrition among elderly patients admitted to the medical and surgical intensive care units (ICU). Clin. Nutr. 2013, 32, 752–757. [Google Scholar] [CrossRef] [PubMed] [Green Version]
- Cascio, B.L.; Logomarsino, J.V. Evaluating the effectiveness of five screening tools used to identify malnutrition risk in hospitalized elderly: A systematic review. Geriatr. Nurs. 2018, 39, 95–102. [Google Scholar] [CrossRef]
- Zhang, Z.; Pereira, S.L.; Luo, M.; Matheson, E.M. Evaluation of Blood Biomarkers Associated with Risk of Malnutrition in Older Adults: A Systematic Review and Meta-Analysis. Nutrients 2017, 9, 829. [Google Scholar] [CrossRef]
- Laviano, A.; Koverech, A.; Zanetti, M. Nutrition support in the time of SARS-CoV-2 (COVID-19). Nutrition 2020, 74, 110834. [Google Scholar] [CrossRef]
- Moher, D.; Liberati, A.; Tetzlaff, J.; Altman, D.G.; PRISMA Group. Preferred reporting items for systematic reviews and meta-analyses: The PRISMA statement. Ann. Intern. Med. 2009, 151, 264–269. [Google Scholar] [CrossRef] [Green Version]
- Wells, G.A.; Shea, B.; O’Connell, D.; Peterson, J.; Welch, V.; Losos, M.; Tugwell, P. The Newcastle-Ottawa Scale (NOS) for Assessing the Quality of Nonrandomised Studies in Meta-Analyses. Available online: http://www.ohri.ca/programs/clinical_epidemiology/oxford.asp (accessed on 20 December 2017).
- The Modified Newcastle Ottawa Scale for Cross Sectional Studies. Available online: http://journals.plos.org/plosone/article/file?id=info%3Adoi/10.1371/journal.pone.0136065.s004&type=supplementary (accessed on 20 December 2017).
- Murad, M.H.; Sultan, S.; Haffar, S.; Bazerbachi, F. Methodological quality and synthesis of case series and case reports. BMJ Evid. Based Med. 2018, 23, 60–63. [Google Scholar] [CrossRef] [Green Version]
- Whiting, P.F.; Rutjes, A.W.; Westwood, M.E.; Mallett, S.; Deeks, J.J.; Reitsma, J.B.; Leeflang, M.M.; Sterne, J.A.; Bossuyt, P.M.; QUADAS-2 Group. QUADAS-2: A revised tool for the quality assessment of diagnostic accuracy studies. Ann. Intern. Med. 2011, 155, 529–536. [Google Scholar] [CrossRef]
- Skipper, A.; Ferguson, M.; Thompson, K.; Castellanos, V.H.; Porcari, J. Nutrition screening tools: An analysis of the evidence. JPEN J. Parenter. Enter. Nutr. 2012, 36, 292–298. [Google Scholar] [CrossRef]
- Håkonsen, S.J.; Pedersen, P.U.; Bath-Hextall, F.; Kirkpatrick, P. Diagnostic test accuracy of nutritional tools used to identify undernutrition in patients with colorectal cancer: A systematic review. JBI Database Syst. Rev. Implement. Rep. 2015, 13, 141–187. [Google Scholar] [CrossRef]
- Boléo-Tomé, C.; Monteiro-Grillo, I.; Camilo, M.; Ravasco, P. Validation of the Malnutrition Universal Screening Tool (MUST) in cancer. Br. J. Nutr. 2012, 108, 343–348. [Google Scholar] [CrossRef] [PubMed]
- Guaitoli, P.R.; Jansma, E.P.; de Vet, H.C. Nutrition screening tools: Does one size fit all? A systematic review of screening tools for the hospital setting. Clin. Nutr. 2014, 33, 39–58. [Google Scholar] [CrossRef] [PubMed]
- De Groot, L.M.; Lee, G.; Ackerie, A.; van der Meij, B.S. Malnutrition Screening and Assessment in the Cancer Care Ambulatory Setting: Mortality Predictability and Validity of the Patient-Generated Subjective Global Assessment Short form (PG-SGA SF) and the GLIM Criteria. Nutrients 2020, 12, 2287. [Google Scholar] [CrossRef] [PubMed]
- Miller, J.; Wells, L.; Nwulu, U.; Currow, D.; Johnson, M.J.; Skipworth, R. Validated screening tools for the assessment of cachexia, sarcopenia, and malnutrition: A systematic review. Am. J. Clin. Nutr. 2018, 108, 1196–1208. [Google Scholar] [CrossRef] [PubMed]
- Seltzer, M.H.; Bastidas, J.A.; Cooper, D.M.; Engler, P.; Slocum, B.; Fletcher, H.S. Instant nutritional assessment. JPEN J. Parenter. Enter. Nutr. 1979, 3, 157–159. [Google Scholar] [CrossRef]
- Swets, J.A. Measuring the accuracy of diagnostic systems. Science 1988, 240, 1285–1293. [Google Scholar] [CrossRef] [Green Version]
- de Vries, M.C.; Koekkoek, W.K.; Opdam, M.H.; van Blokland, D.; van Zanten, A.R. Nutritional assessment of critically ill patients: Validation of the modified NUTRIC score. Eur. J. Clin. Nutr. 2018, 72, 428–435. [Google Scholar] [CrossRef] [Green Version]
- Jouneau, S.; Kerjouan, M.; Rousseau, C.; Lederlin, M.; Llamas-Guttierez, F.; De Latour, B.; Guillot, S.; Vernhet, L.; Desrues, B.; Thibault, R. What are the best indicators to assess malnutrition in idiopathic pulmonary fibrosis patients? A cross-sectional study in a referral center. Nutrition 2019, 62, 115–121. [Google Scholar] [CrossRef]
- Zhang, P.; He, Z.; Yu, G.; Peng, D.; Feng, Y.; Ling, J.; Wang, Y.; Li, S.; Bian, Y. The modified NUTRIC score can be used for nutritional risk assessment as well as prognosis prediction in critically ill COVID-19 patients. Clin. Nutr. 2020, in press. [Google Scholar] [CrossRef]
- Li, T.; Zhang, Y.; Gong, C.; Wang, J.; Liu, B.; Shi, L.; Duan, J. Prevalence of malnutrition and analysis of related factors in elderly patients with COVID-19 in Wuhan, China. Eur. J. Clin. Nutr. 2020, 74, 871–875. [Google Scholar] [CrossRef] [PubMed] [Green Version]
- Yuan, Y.; Wang, N.; Ou, X. Caution should be exercised for the detection of SARS-CoV-2, especially in the elderly. J. Med. Virol. 2020, 74, 1641–1648. [Google Scholar] [CrossRef] [PubMed] [Green Version]
- Liu, G.; Zhang, S.; Mao, Z.; Wang, W.; Hu, H. Clinical significance of nutritional risk screening for older adult patients with COVID-19. Eur. J. Clin. Nutr. 2020, 74, 876–883. [Google Scholar] [CrossRef] [PubMed]
- Abbott, J.; Teleni, L.; McKavanagh, D.; Watson, J.; McCarthy, A.L.; Isenring, E. Patient-Generated Subjective Global Assessment Short Form (PG-SGA SF) is a valid screening tool in chemotherapy outpatients. Support. Care Cancer 2016, 24, 3883–3887. [Google Scholar] [CrossRef] [PubMed]
- Tran, Q.C.; Banks, M.; Hannan-Jones, M.; Do, T.; Gallegos, D. Validity of four nutritional screening tools against subjective global assessment for inpatient adults in a low-middle income country in Asia. Eur. J. Clin. Nutr. 2018, 72, 979–985. [Google Scholar] [CrossRef]
- Poulia, K.A.; Klek, S.; Doundoulakis, I.; Bouras, E.; Karayiannis, D.; Baschali, A.; Passakiotou, M.; Chourdakis, M. The two most popular malnutrition screening tools in the light of the new ESPEN consensus definition of the diagnostic criteria for malnutrition. Clin. Nutr. 2017, 36, 1130–1135. [Google Scholar] [CrossRef]
- Rubin, G.D.; Ryerson, C.J.; Haramati, L.B.; Sverzellati, N.; Kanne, J.P.; Raoof, S.; Schluger, N.W.; Volpi, A.; Yim, J.J.; Martin, I.; et al. The Role of Chest Imaging in Patient Management during the COVID-19 Pandemic: A Multinational Consensus Statement From the Fleischner Society. Chest 2020, 158, 106–116. [Google Scholar] [CrossRef]
- Chen, T.; Dai, Z.; Mo, P.; Li, X.; Ma, Z.; Song, S.; Chen, X.; Luo, M.; Liang, K.; Gao, S.; et al. Clinical characteristics and outcomes of older patients with coronavirus disease 2019 (COVID-19) in Wuhan, China (2019): A single-centered, retrospective study. J. Gerontol. A Biol. Sci. Med. Sci. 2020, 75, 1788–1795. [Google Scholar] [CrossRef]
- Bhatraju, P.K.; Ghassemieh, B.J.; Nichols, M.; Kim, R.; Jerome, K.R.; Nalla, A.K.; Greninger, A.L.; Pipavath, S.; Wurfel, M.M.; Evans, L.; et al. Covid-19 in Critically Ill Patients in the Seattle Region—Case Series. N. Engl. J. Med. 2020, 382, 2012–2022. [Google Scholar] [CrossRef]
- Zhao, X.; Li, Y.; Ge, Y.; Shi, Y.; Lv, P.; Zhang, J.; Fu, G.; Zhou, Y.; Jiang, K.; Lin, N.; et al. Evaluation of Nutrition Risk and Its Association With Mortality Risk in Severely and Critically Ill COVID-19 Patients. JPEN J. Parenter. Enter. Nutr. 2020, in press. [Google Scholar] [CrossRef]
- Cook, Z.; Kirk, S.; Lawrenson, S.; Sandford, S. Use of BMI in the assessment of undernutrition in older subjects: Reflecting on practice. Proc. Nutr. Soc. 2005, 64, 313–317. [Google Scholar] [CrossRef] [PubMed] [Green Version]
- Souza, R.; Fraga, J.S.; Gottschall CB, A.; Busnello, F.M.; Rabito, E.I. Avaliação antropométrica em idosos: Estimativas de peso e altura e concordância entre classificações de IMC. Rev. Bras. Geriatr. Gerontol. 2013, 16, 81–90. [Google Scholar] [CrossRef] [Green Version]
- Hajifathalian, K.; Kumar, S.; Newberry, C.; Shah, S.; Fortune, B.; Krisko, T.; Ortiz-Pujols, S.; Zhou, X.K.; Dannenberg, A.J.; Kumar, R.; et al. Obesity is associated with worse outcomes in COVID-19: Analysis of Early Data From New York City. Obesity 2020, 28, 1606–1612. [Google Scholar] [CrossRef] [PubMed]
- Higham, A.; Singh, D. Increased ACE2 Expression in Bronchial Epithelium of COPD Patients who are Overweight. Obesity 2020, 28, 1586–1589. [Google Scholar] [CrossRef] [PubMed]
- Allard, J.P.; Keller, H.; Jeejeebhoy, K.N.; Laporte, M.; Duerksen, D.R.; Gramlich, L.; Payette, H.; Bernier, P.; Davidson, B.; Teterina, A.; et al. Decline in nutritional status is associated with prolonged length of stay in hospitalized patients admitted for 7 days or more: A prospective cohort study. Clin. Nutr. 2016, 35, 144–152. [Google Scholar] [CrossRef]
- Wang, W.; Tang, J.; Wei, F. Updated understanding of the outbreak of 2019 novel coronavirus (2019-nCoV) in Wuhan, China. J. Med. Virol. 2020, 92, 441–447. [Google Scholar] [CrossRef] [Green Version]
- González Madroño, A.; Mancha, A.; Rodríguez, F.J.; de Ulibarri, J.I.; Culebras, J. The use of biochemical and immunological parameters in nutritional screening and assessment. Nutr. Hosp. 2011, 26, 594–601. [Google Scholar] [CrossRef]
- Lomivorotov, V.V.; Efremov, S.M.; Boboshko, V.A.; Nikolaev, D.A.; Vedernikov, P.E.; Lomivorotov, V.N.; Karaskov, A.M. Evaluation of nutritional screening tools for patients scheduled for cardiac surgery. Nutrition 2013, 29, 436–442. [Google Scholar] [CrossRef]
- Ignacio de Ulíbarri, J.; González-Madroño, A.; de Villar, N.G.; González, P.; González, B.; Mancha, A.; Rodríguez, F.; Fernández, G. CONUT: A tool for controlling nutritional status. First validation in a hospital population. Nutr. Hosp. 2005, 20, 38–45. [Google Scholar]
- Elmore, M.F.; Wagner, D.R.; Knoll, D.M.; Eizember, L.; Oswalt, M.A.; Glowinski, E.A.; Rapp, P.A. Developing an effective adult nutrition screening tool for a community hospital. J. Am. Diet. Assoc. 1994, 94, 1113–1120. [Google Scholar] [CrossRef]
- Arroyo, V.; García-Martinez, R.; Salvatella, X. Human serum albumin, systemic inflammation, and cirrhosis. J. Hepatol. 2014, 61, 396–407. [Google Scholar] [CrossRef] [PubMed] [Green Version]
- Hrnciarikova, D.; Juraskova, B.; Hyspler, R.; Solichova, D.; Ticha, A.; Klemera, P.; Hronek, M.; Zadak, Z. A changed view of serum prealbumin in the elderly: Prealbumin values influenced by concomitant inflammation. Biomed. Pap. Med. Fac. Univ. Palacky Olomouc 2007, 151, 273–276. [Google Scholar] [CrossRef] [PubMed]
- Nalbant, A.; Cinemre, H.; Kaya, T.; Varim, C.; Varim, P.; Tamer, A. Neutrophil to lymphocyte ratio might help prediction of acute myocardial infarction in patients with elevated serum creatinine. Pak. J. Med. Sci. 2016, 32, 106–110. [Google Scholar] [CrossRef] [PubMed]
- Pasini, E.; Corsetti, G.; Aquilani, R.; Romano, C.; Picca, A.; Calvani, R.; Dioguardi, F.S. Protein-Amino Acid Metabolism Disarrangements: The Hidden Enemy of Chronic Age-Related Conditions. Nutrients 2018, 10, 391. [Google Scholar] [CrossRef] [Green Version]
- Zhou, Y.; Fu, B.; Zheng, X.; Wang, D.; Zhao, C.; Qi, Y.; Sun, R.; Tian, Z.; Xu, X.; Wei, H. Pathogenic T-cells and inflammatory monocytes incite inflammatory storms in severe COVID-19 patients. Natl. Sci. Rev. 2020, 7, 998–1002. [Google Scholar] [CrossRef] [Green Version]
- Aouba, A.; Baldolli, A.; Geffray, L.; Verdon, R.; Bergot, E.; Martin-Silva, N.; Justet, A. Targeting the inflammatory cascade with anakinra in moderate to severe COVID-19 pneumonia: Case series. Ann. Rheum. Dis. 2020, 79, 1381–1382. [Google Scholar] [CrossRef]
- Fuhrman, M.P. The albumin-nutrition connection: Separating myth from fact. Nutrition 2020, 18, 199–200. [Google Scholar] [CrossRef]
- Fanali, G.; di Masi, A.; Trezza, V.; Marino, M.; Fasano, M.; Ascenzi, P. Human serum albumin: From bench to bedside. Mol. Aspects Med. 2012, 33, 209–290. [Google Scholar] [CrossRef]
- de Ulíbarri Pérez, J.I.; Fernández, G.; Rodríguez Salvanés, F.; Díaz López, A.M. Nutritional screening; control of clinical undernutrition with analytical parameters. Nutr. Hosp. 2014, 29, 797–811. [Google Scholar] [CrossRef]
- Soeters, P.B.; Wolfe, R.R.; Shenkin, A. Hypoalbuminemia: Pathogenesis and Clinical Significance. JPEN J. Parenter. Enter. Nutr. 2019, 43, 181–193. [Google Scholar] [CrossRef] [Green Version]
- Fang, X.; Mei, Q.; Yang, T.; Li, L.; Wang, Y.; Tong, F.; Geng, S.; Pan, A. Low-dose corticosteroid therapy does not delay viral clearance in patients with COVID-19. J. Infect. 2020, 81, 147–178. [Google Scholar] [CrossRef] [PubMed]
- Thorsdottir, I.; Gunnarsdottir, I.; Eriksen, B. Screening method evaluated by nutritional status measurements can be used to detect malnourishment in chronic obstructive pulmonary disease. J. Am. Diet. Assoc. 2001, 101, 648–654. [Google Scholar] [CrossRef]
- Yang, D.; Zheng, Z.; Zhao, Y.; Zhang, T.; Liu, Y.; Xu, X. Patient-generated subjective global assessment versus nutritional risk screening 2002 for gastric cancer in Chinese patients. Future Oncol. 2020, 16, 4475–4483. [Google Scholar] [CrossRef] [PubMed]
- Tamang, M.K.; Yadav, U.N.; Hosseinzadeh, H.; Kafle, B.; Paudel, G.; Khatiwada, S.; Sekaran, V.C. Nutritional assessment and factors associated with malnutrition among the elderly population of Nepal: A cross-sectional study. BMC Res. Notes 2019, 12, 246. [Google Scholar] [CrossRef] [Green Version]
- Zhang, X.; Zhang, X.; Zhu, Y.; Tao, J.; Zhang, Z.; Zhang, Y.; Wang, Y.; Ke, Y.; Ren, C.; Xu, J. Predictive Value of Nutritional Risk Screening 2002 and Mini Nutritional Assessment Short Form in Mortality in Chinese Hospitalized Geriatric Patients. Clin. Interv. Aging 2020, 15, 441–449. [Google Scholar] [CrossRef] [Green Version]
- Sanz-París, A.; Gómez-Candela, C.; Martín-Palmero, Á.; García-Almeida, J.M.; Burgos-Pelaez, R.; Matía-Martin, P.; Arbones-Mainar, J.M.; Study VIDA Group. Application of the new ESPEN definition of malnutrition in geriatric diabetic patients during hospitalization: A multicentric study. Clin. Nutr. 2016, 35, 1564–1567. [Google Scholar] [CrossRef]
- Sanz París, A.; García, J.M.; Gómez-Candela, C.; Burgos, R.; Martín, Á.; Matía, P.; Study VIDA Group. Malnutrition prevalence in hospitalized elderly diabetic patients. Nutr. Hosp. 2013, 28, 592–599. [Google Scholar] [CrossRef] [Green Version]
- Guo, W.; Li, M.; Dong, Y.; Zhou, H.; Zhang, Z.; Tian, C.; Qin, R.; Wang, H.; Shen, Y.; Du, K.; et al. Diabetes is a risk factor for the progression and prognosis of COVID-19. Diabetes Metab. Res. Rev. 2020, e3319, in press. [Google Scholar] [CrossRef] [Green Version]
- Maddaloni, E.; Buzzetti, R. Covid-19 and diabetes mellitus: Unveiling the interaction of two pandemics. Diabetes Metab. Res. Rev. 2020, e33213321, in press. [Google Scholar] [CrossRef]
- Dietz, W.; Santos-Burgoa, C. Obesity and its Implications for COVID-19 Mortality. Obesity 2020, 28, 1005. [Google Scholar] [CrossRef] [Green Version]
- Stefan, N.; Birkenfeld, A.L.; Schulze, M.B.; Ludwig, D.S. Obesity and impaired metabolic health in patients with COVID-19. Nat. Rev. Endocrinol. 2020, 16, 341–342. [Google Scholar] [CrossRef] [PubMed] [Green Version]
- Colosia, A.D.; Palencia, R.; Khan, S. Prevalence of hypertension and obesity in patients with type 2 diabetes mellitus in observational studies: A systematic literature review. Diabetes Metab. Syndr. Obes. 2013, 6, 327–338. [Google Scholar] [CrossRef] [PubMed] [Green Version]
- Yildirim, Z.G.; Uzunlulu, M.; Caklili, O.T.; Mutlu, H.H.; Oguz, A. Malnutrition rate among hospitalized patients with type 2 diabetes mellitus. Prog. Nutr. 2018, 20, 183–188. [Google Scholar] [CrossRef]
- Rahman, A.; Hasan, R.M.; Agarwala, R.; Martin, C.; Day, A.G.; Heyland, D.K. Identifying critically-ill patients who will benefit most from nutritional therapy: Further validation of the “modified NUTRIC” nutritional risk assessment tool. Clin. Nutr. 2016, 35, 158–162. [Google Scholar] [CrossRef] [PubMed]
- Thomas, J.; Kaambwa, B.; Delaney, C.; Miller, M. An evaluation of the validity of nutrition screening and assessment tools in patients admitted to a vascular surgery unit. Br. J. Nutr. 2019, 122, 689–697. [Google Scholar] [CrossRef]
- Hersberger, L.; Bargetzi, L.; Bargetzi, A.; Tribolet, P.; Fehr, R.; Baechli, V.; Geiser, M.; Deiss, M.; Gomes, F.; Kutz, A.; et al. Nutritional risk screening (NRS 2002) is a strong and modifiable predictor risk score for short-term and long-term clinical outcomes: Secondary analysis of a prospective randomised trial. Clin. Nutr. 2020, 39, 2720–2729. [Google Scholar] [CrossRef]
- Lew, C.; Yandell, R.; Fraser, R.; Chua, A.P.; Chong, M.; Miller, M. Association between Malnutrition and Clinical Outcomes in the Intensive Care Unit: A Systematic Review. JPEN J. Parenter. Enter. Nutr. 2017, 41, 744–758. [Google Scholar] [CrossRef]
- Rabito, E.I.; Marcadenti, A.; da Silva Fink, J.; Figueira, L.; Silva, F.M. Nutritional Risk Screening 2002, Short Nutritional Assessment Questionnaire, Malnutrition Screening Tool, and Malnutrition Universal Screening Tool Are Good Predictors of Nutrition Risk in an Emergency Service. Nutr. Clin. Pract. 2017, 32, 526–532. [Google Scholar] [CrossRef]
- Brugliera, L.; Spina, A.; Castellazzi, P.; Cimino, P.; Arcuri, P.; Negro, A.; Houdayer, E.; Alemanno, F.; Giordani, A.; Mortini, P.; et al. Nutritional management of COVID-19 patients in a rehabilitation unit. Eur. J. Clin. Nutr. 2020, 74, 860–863. [Google Scholar] [CrossRef]
- Krznarić, Ž.; Bender, D.V.; Laviano, A.; Cuerda, C.; Landi, F.; Monteiro, R.; Pirlich, M.; Barazzoni, R. A simple remote nutritional screening tool and practical guidance for nutritional care in primary practice during the COVID-19 pandemic. Clin. Nutr. 2020, 39, 1983–1987. [Google Scholar] [CrossRef]


| Cohort—Newcastle-Ottawa Scale | |||||||||
|---|---|---|---|---|---|---|---|---|---|
| Selection | Comparability | Outcome | |||||||
| Quality criteria | 1. Representativeness of the exposed cohort | 2. Selection of the non-exposed cohort | 3. Ascertainment of exposure | 4. Demonstration that outcome of interest was not present at start of study | 1. Comparability of cohorts on the basis of the design or analysis | 1. Assessment of outcome | 2. Was follow-up long enough for outcomes to occur? | 3. Adequacy of follow up of cohorts | |
| Liu et al., 2020 [46] | * | * | ** | * | * | * | |||
| Zhang et al., 2020 [43] | * | * | ** | * | * | * | |||
| Cross-sectional—Newcastle–Ottawa Scale | |||||||||
| Selection | Comparability | Outcome | |||||||
| Quality criteria | 1. Representativeness of the sample | 2. Sample size | 3. Ascertainment of exposure | 4. Non-respondents | 1. The subjects in different outcome groups are comparable, based on the study design or analysis. Confounding factors are controlled. | 1. Assessment of outcome | 2. Statistical test | ||
| Li et al., 2020 [44] | * | * | ** | ** | * | ||||
| Case series—Murad et al. (2018) | |||||||||
| Selection | Ascertainment | Causality | Reporting | ||||||
| Quality criteria | 1. Does the patient (s) represent (s) the whole experience of the investigator (center), or is the selection method unclear to the extent that other patients with similar presentation may not have been reported? | 2. Was the exposure adequately ascertained? | 3. Was the outcome adequately ascertained? | 4. Were other alternative causes that may explain the observation ruled out? | 5. Was there a challenge/rechallenge phenomenon? | 6. Was there a dose–response effect? | 7. Was follow-up long enough for outcomes to occur? | 8. Is the case (s) described with sufficient details to allow other investigators to replicate the research or to allow practitioners make inferences related to their own practice? | |
| Yuan et al., 2020 [45] | * | * | NA | NA | NA | * | * | ||
| Domain | Item | Liu et al., 2020 [46] | Li et al., 2020 [44] | Yuan et al., 2020 [45] | Zhang et al., 2020 [43] | |
|---|---|---|---|---|---|---|
| Patient Selection | Signaling questions (yes/no/unclear) | Was a consecutive or random sample of patients enrolled? | No | No | No | Yes |
| Was a case–control design avoided? | Yes | Yes | Yes | Yes | ||
| Did the study avoid inappropriate exclusions? | Yes | Yes | No | Yes | ||
| Risk of bias: High/low/unclear | Could the selection of patients have introduced bias? | High | High | High | Low | |
| Concerns regarding applicability: High/low/unclear | Are there concerns that the included patients do not match the review question? | Low | Low | Low | Low | |
| Index Test | Signaling questions (yes/no/unclear) | Were the index test results interpreted without knowledge of the results of the reference standard? | Unclear | - | - | - |
| If a threshold was used, was it pre-specified? | Yes | Yes | Yes | Yes | ||
| Risk of bias: High/low/unclear | Could the conduct or interpretation of the index test have introduced bias? | Low | Low | Low | Low | |
| Concerns regarding applicability: High/low/unclear | Are there concerns that the index test, its conduct, or interpretation differ from the review question? | Low | Low | Low | Low | |
| Reference Standard | Signaling questions (yes/no/unclear) | Is the reference standard likely to correctly classify the target condition? | Yes | Yes | - | - |
| Were the reference standard results interpreted without knowledge of the results of the index test? | Unclear | Unclear | - | - | ||
| Risk of bias: High/low/unclear | Could the reference standard, its conduct, or its interpretation have introduced bias? | Low | Low | - | - | |
| Concerns regarding applicability: High/low/unclear | Are there concerns that the target condition as defined by the reference standard does not match the review question? | Low | Low | - | - | |
| Flow and Timing | Signaling questions (yes/no/unclear) | Was there an appropriate interval between index test (s) and reference standard? | Yes | Yes | - | - |
| Did all patients receive a reference standard? | Yes | Yes | - | - | ||
| Did all patients receive the same reference standard? | Yes | Yes | - | - | ||
| Were all patients included in the analysis? | Yes | Yes | - | - | ||
| Risk of bias: High/low/unclear | Could the patient flow have introduced bias? | Low | Low | - | - | |
| Author | Country | Design | n | Age Group (Years) | Sex | Nutritional Screening Tool | Nutritional Risk |
|---|---|---|---|---|---|---|---|
| Liu et al., 2020 [46] | China | Retrospective cohort | 141 | 65 to 87 | Women: 73. Men: 68 | NRS-2002-NR: score ≥ 3 (out of a maximum of 6); MNA-sf-NR: score < 12 (out of a maximum of 14); MUST-NR: score ≥ 2 (out of a maximum of 6); NRI-SNR: score < 83.5 and no NR > 100. | NRS-2002: 120 (85.1%); MNA-sf: 109 (77.3%); MUST: 58 (41.1%); NRI: 101 (60.4%). |
| Li et al., 2020 [44] | China | Cross-sectional | 182 | Average age of 68.5 years old | Women: 117. Man: 65. | MNA: No NR/malnutrition ≥ 24; risk of malnutrition: 17–23.5; malnutrition < 17. | No nutritional risk/malnutrition: 36 (19.8%); risk of malnutrition: 50 (27.5%); malnutrition: 96 (52.7%). |
| Yuan et al., 2020 [45] | China | Case series | 61 | 65 to 71 | Women: 4. Man: 2. | GNRI: High NR: score < 82—cut-off point used to diagnose nutritional risk in the study; moderate NR: score from 82 to <92; low NR: score from 92 to ≤98; no risk: score > 98. | 4 (100%). |
| Zhang et al., 2020 [43] | China | Retrospective cohort | 136 | Average age 69 years | Women: 50 (37%) Man: 86 (63%) | mNUTRIC score. High NR ≥ 5. Low NR < 5. | High NR: 83 (61.0%). Low NR: 53 (39.0%). |
| Tool | Criteria | Score | Applications |
|---|---|---|---|
| NRI | NRI = (1.519 × serum albumin (g/L) + 41.7 × (present weight/usual weight) | No NR > 100. Mild risk: 97.5–100. Moderate risk: 83.5–97.5. High risk < 83.5. | Recommended settings: hospital, and home care. |
| GNRI | GNRI = (14.89 × albumin (g/dL)) + (41.7 × (body weight/ideal body weight)) | Low NR 92–≤98. Moderate NR: 82–<92. High NR <82. | Recommended settings: hospital. |
| MUST | Three domains: BMI, weight loss, and consequences of disease severity. Each parameter can be rated as 0, 1, or 2. BMI domain: BMI (kg/m2) > 20 (0), 18.5–20.0 (1), <18.5 (2). Unintentional weight loss in past 3–6 months (%): <5 (0), 5–10 (1), >10 (2). Disease severity domain: drastic reduction of food consumption or inability to eat on more than five days (2). | Low NR: 0. Medium NR: 1. High NR ≥ 2. | Recommended settings: hospital, home care, and community. |
| NRS-2002 | Two domains: disease severity score and nutritional score. Disease severity score domain: patients with diabetes, cancer, COPD (1 point); patients with severe pneumonia (2 points); intensive care patients (APACHE > 10) (3 points). Nutritional score domain: Weight loss greater than 5% in the last three months or food intake between 50% and 75% of nutritional needs (1 point); weight loss greater than 5% in the last two months, food intake between 25% and 60% of nutritional needs, or BMI 18.5–20.5 with impaired general health (2 points); weight loss greater than 5% in one month, >15% in three months, or food intake between 0% and 25% of nutritional needs (3 points). Score adjusted for age: if ≥70 years, one additional point. | NR: score ≥ 3. | Recommended settings: hospital, home care, and community. |
| NUTRIC score | Six domains: age, APACHE, SOFA, number of comorbidities, days from hospital to ICU admission, and IL-6. Age: <50 (0); 50–74 (1); ≥75 (2). APACHE II: <15 (0); 15–19 (1); 20–28 (2); ≥28 (3). SOFA: <6 (0); 6–9 (1); ≥10 (2). Number of comorbidities: 0–1 (0); ≥2 (1). Days from hospital to ICU admission: 0–<1 (0); ≥(1). IL-6: 0-<400 (0); ≥400 (1). | Score with IL-6: Low NR: 0–5. High NR: 6–10. Score without IL-6: Low NR: 0–4. High NR: 5–9. | Recommended settings: critically ill patients (ICU). |
| MNA-sf | Six domains: decrease in food intake, weight loss, mobility, disease severity, neuropsychological problems (depression, dementia), and BMI. Decrease in food intake: severe (0); moderate (1); none (2). Involuntary weight loss during the last three months? >3 kg (0); does not know (1); 1–3 kg (2); none (3). Mobility: bedridden (0); able to get out of bed/chair but does not go out (1); goes out (2). Disease severity: acute disease or psychological stress in the past 3 months (0); no acute disease or psychological stress in the past 3 months (2). Neuropsychological problems: severe depression or dementia (0); mild dementia (1); none (2). BMI (kg/m2): <19 (0); <21 (1); <23 (2); ≥23 (3). | Normal: 12–14. Risk of malnutrition: 8–11. Malnutrition: 0–7. | Recommended settings: hospital, home care, and community. |
| MNA | 18 domains: decrease in food intake, weight loss, mobility, disease severity, neuropsychological problems (depression, dementia), and BMI (For these domains, same criteria as in the MNA-sf.). Other domains: lives independently, medication, pressure sores or skin ulcers, number of full meals daily, markers for protein intake, fruit or vegetable consumption, fluid intake, mode of feeding, self-view of nutritional status, self-assessment of health status, mid-arm circumference in cm, and calf circumference in cm. | Normal: 24–30. At risk of malnutrition: 17–23.5. Malnutrition < 17. | Recommended settings: hospital, home care, and community. |
| Author | Screening Tool | Reference Standard | TP | FP | FN | TN | Sensitivity (95%CI) | Specificity (95% CI) | PPV (%) | NPV (%) | Other Analysis |
|---|---|---|---|---|---|---|---|---|---|---|---|
| Liu et al., 2020 [46] | NRS-2002 | BMI | 7 | 113 | 0 | 21 | 100 (59 to 100) | 16 (10 to 23) | 5.8 | 100 | - |
| Liu et al., 2020 [46] | NRS-2002 | MUST | 57 | 63 | 1 | 20 | 98 (91 to 100) | 24(15 to 35) | 47.5 | 95.2 | - |
| Liu et al., 2020 [46] | NRS-2002 | MNA-sf | 102 | 18 | 7 | 14 | 94 (87 to 97) | 44 (26 to 62) | 85.0 | 66.7 | - |
| Liu et al., 2020 [46] | NRS-2002 | NRI | 98 | 22 | 3 | 18 | 97 (92 to 99) | 45 (29 to 62) | 81.7 | 85.7 | - |
| Liu et al., 2020 [46] | MUST | BMI | 7 | 51 | 0 | 83 | 100 (59 to 100) | 62 (53 to 70) | 12.1 | 100 | - |
| Liu et al., 2020 [46] | MUST | NRS-2002 | 57 | 1 | 63 | 20 | 47 (38 to 57) | 95 (76 to 100) | 98.3 | 24.1 | - |
| Liu et al., 2020 [46] | MUST | MNA-sf | 57 | 52 | 1 | 31 | 98 (91 to 100) | 37 (27 to 49) | 52.3 | 96.9 | - |
| Liu et al., 2020 [46] | MUST | NRI | 53 | 5 | 48 | 35 | 52 (42 to 63) | 88 (73 to 96) | 91.4 | 42.2 | - |
| Liu et al., 2020 [46] | MNA-sf | BMI | 7 | 102 | 0 | 32 | 100 (59 to 100) | 24 (17 to 32) | 6.4 | 100 | - |
| Liu et al., 2020 [46] | MNA-sf | NRI | 86 | 23 | 15 | 17 | 85 (77 to 91) | 42 (27 to 59) | 78.9 | 53.1 | - |
| Liu et al., 2020 [46] | MNA-sf | NRS-2002 | 102 | 3 | 22 | 18 | 82 (74 to 99) | 86 (64 to 97) | 97.1 | 45.0 | - |
| Liu et al., 2020 [46] | MNA-sf | MUST | 57 | 1 | 52 | 31 | 52 (43 to 62) | 97 (84 to 100) | 98.3 | 37.4 | - |
| Liu et al., 2020 [46] | NRI | BMI | 7 | 94 | 0 | 40 | 100 (59 to 100) | 30 (22 to 38) | 6.9 | 100 | - |
| Liu et al., 2020 [46] | NRI | MNA-sf | 86 | 15 | 23 | 17 | 79 (70 to 86) | 53 (35 to 71) | 85.2 | 42.5 | - |
| Liu et al., 2020 [46] | NRI | NRS-2002 | 98 | 3 | 22 | 18 | 82 (74 to 88) | 86 (64 to 97) | 97.0 | 45.0 | - |
| Liu et al., 2020 [46] | NRI | MUST | 53 | 48 | 35 | 5 | 60 (49 to 61) | 9 (3 to 21) | 52.5 | 12.5 | - |
| Li et al., 2020 [44] | MNA | BMI | - | - | - | - | - | - | - | - | BMI (kg/m2)—no malnutrition: 25.6 ± 3.0; risk of malnutrition: 23.3 ± 3.4 kg/m2; malnutrition: 21.1 ± 3.6 kg/m2. F or X2 value: 4.106, p = 0.035. |
| Li et al., 2020 [44] | MNA | Calf circumference (cm) | - | - | - | - | - | - | - | - | Calf circumference (cm)—no malnutrition: 33.4 ± 5.6; risk of malnutrition: 31.2 ± 4.8; malnutrition: 28.7 ± 5.7, F or X2 value: 2.518, p = 0.047. |
| Li et al., 2020 [44] | MNA | Albumin (g/L) | - | - | - | - | - | - | - | - | Albumin (g/L)—no malnutrition: 38.5 ± 4.2; risk of malnutrition: 30.1 ± 6.4; malnutrition: 25.7 ± 5.3, F or X2 value: 10.217, p < 0.001. |
| Li et al., 2020 [44] | MNA | TLC | - | - | - | - | - | - | - | - | TLC—no malnutrition: 1.7 ± 0.52; risk of malnutrition: 1.2 ± 0.43, malnutrition: 0.9 ± 0.38, F or X2 value: 11.237, p < 0.001. |
| Li et al., 2020 [44] | MNA | TSFT (mm) | - | - | - | - | - | - | - | - | TSFT (mm)—no malnutrition: 16.8 ± 7.2; risk of malnutrition: 15.7 ± 6.9; malnutrition: 14.9 ± 7.3, F or X2 value: 1.632, p = 0.126. |
| Li et al., 2020 [44] | MNA | MAC (cm) | - | - | - | - | - | - | - | - | MAC (cm)—no malnutrition: 28.7 ± 2.8; risk of malnutrition: 27.6 ± 3.3; malnutrition: 26.5 ± 3.2, F or X2 value: 2.679, p = 0.379. |
| Yuan et al., 2020 [45] | GNRI | TLC | - | - | - | - | - | - | - | - | Of the four patients at nutritional risk, one had low TLC levels and three had normal levels. |
| Zhang et al., 2020 [43] | NUTRIC score | Albumin (g/L) | - | - | - | - | - | - | - | - | High NR group (n = 83): 29 g/L (25–32). Low NR group (n = 53): 30 g/L (28–32), p = 0.107. |
| Zhang et al., 2020 [43] | NUTRIC score | Prealbumin (g/L) | - | - | - | - | - | - | - | - | High NR group (n = 83): 82 g/L (80–122). Low NR group (n = 53): 95 (80–128) g/L, p = 0.281. |
| Zhang et al., 2020 [43] | NUTRIC score | TLC | - | - | - | - | - | - | - | - | High NR group (n = 83): 0.5 × 10⁹/L (0.3–0.7). Low NR group (n = 53): 0.6 × 10⁹/L (0.4–0.9), p = 0.007. |
| Zhang et al., 2020 [43] | NUTRIC score | Creatinine (mmol/L) | - | - | - | - | - | - | - | - | High NR group (n = 83): 90 (65–144) mmol/L. Low NR group (n = 53): 67 (54–85) mmol/L, p < 0.001. |
| Author | NST | Length of Stay (LOS) | Appetite Change | Weight Change | Hospital Expenses | Complications | Mortality |
|---|---|---|---|---|---|---|---|
| Liu et al., 2020 [46] | NRS-2002 | Nutritional risk predicted longer LOS; OR (95% CI): 0.102 (0.042–0.250), p = 0.000; AUC for LOS > 30 days (95% CI): 0.724 (0.640–0.808), p = 0.000. Rating: Weak. | Nutritional risk predicted change in appetite; OR (95% CI) for no change: 11.179 (3.881–32.169), p = 0.000; AUC for poor appetite (95% CI): 0.670 (0.586–0.747), p = 0.014. Rating: Poor. | Nutritional risk predicted weight change; OR (95% CI): 0.128 (0.047–0.350), p = 0.000; AUC for weight change >2.6 kg (95% CI): 0.613 (0.528–0.694), p = 0.000. Rating: Poor. | Nutritional risk predicted higher hospital expenses (CNY); OR (95% CI): 0.131 (0.054–0.313), p = 0.000; AUC for hospital expenses > CNY 56,163 (95% CI): 0.667 (0.583–0.744), p = 0.000. Rating: Poor. | Nutritional risk predicted greater disease severity; OR (95% CI): 0.095 (0.031–0.292), p = 0.000. | - |
| Liu et al., 2020 [46] | MNA-sf | Nutritional risk predicted longer LOS; OR (95% CI): 0.401 (0.198–0.813), p = 0.011; AUC for LOS > 30 days (95% CI): 0.602 (0.304–0.492), p = 0.032. Rating: Poor. | Nutritional risk predicted change in appetite; OR (95% CI) for no change: 40.731 (13.681–121.389), p = 0.000; AUC for poor appetite (95% CI): 0.868 (0.801–0.919), p = 0.000. Rating: Good. | Nutritional risk predicted weight change; OR (95% CI): 0.085 (0.035–0.206), p = 0.000; AUC for weight change >2.6 kg (95% CI): 0.895 (0.832–0.940), p = 0.000. Rating: Good. | Nutritional risk predicted higher hospital expenses (CNY); OR (95% CI): 0.436 (0.216–0.880), p = 0.021; AUC for hospital expenses > CNY 56,163 (95% CI): 0.597 (0.511–0.679), p = 0.063. Rating: Failure. | Nutritional risk predicted greater disease severity; OR (95% CI): 0.632 (0.289–1.382), p = 0.250. Rating: Poor. | - |
| Liu et al., 2020 [46] | MUST | Nutritional risk did not predict longer LOS; OR (95% CI): 0.722 (0.391–1.334), p = 0.298; non-significant AUC for LOS > 30 days (95% CI): 0.506 (0.421–0.591), p = 0.887. | Nutritional risk predicted change in appetite; OR (95%CI) for no change: 2.866 (1.449–5.669), p = 0.002; AUC for poor appetite (95% CI): 0.614 (0.528–0.694), p = 0.009. Rating: Poor. | Nutritional risk predicted weight change; OR (95% CI): 0.009 (0.003–0.026), p = 0.000; AUC for weight change >2.6 kg (95% CI): 0.887 (0.823–0.934), p = 0.000. Rating: Good. | Nutritional risk did not predict higher hospital expenses (CNY); OR (95% CI): 0.599 (0.323–1.109), p = 0.103; non-significant AUC for hospital expenses > CNY 56,163 (95% CI): 0.516 (0.430–0.601), p = 0.735. | Nutritional risk did not predict greater disease severity OR (95% CI): 1.367 (0.688–2.718), p = 0.372. | - |
| Liu et al., 2020 [46] | NRI | Nutritional risk predicted longer LOS; OR (95% CI): 0.261 (0.133–0.513), p = 0.000; AUC for LOS > 30 days (95% CI): 0.664 (−0.579 to 0.741), p = 0.000. Rating: Poor. | Nutritional risk predicted change in appetite; OR (95% CI) for no change: 2.768 (1.363–5.618). p = 0.005; AUC for poor appetite (95% CI): 0.629 (0.544–0.709), p = 0.014. Rating: Poor. | Nutritional risk predicted weight change; OR (95% CI): 0.182 (0.087–0.378), p = 0.000; AUC for weight change >2.6 kg (95% CI): 0.697 (0.614–0.772), p = 0.000. Rating: Poor. | Nutritional risk predicted higher hospital expenses (CNY); OR (95% CI): 0.199 (0.100–0.397), p = 0.000; AUC for hospital expenses > CNY 56,163 (95% CI): 0.621 (0.535–0.701), p = 0.019. Rating: Poor. | Nutritional risk predicted greater disease severity; OR (95% CI): 0.367 (0.173–0.776), p = 0.009. | - |
| Zhang et al., 2020 [43] | mNUTRIC score | Nutritional risk correlated with complications during ICU stay: ARDS (p < 0.001), shock (p < 0.001), acute myocardial injury (p = 0.002), and secondary infection (p = 0.002). Rating: Good. No correlation with acute liver dysfunction (p = 0.820), acute kidney injury (p = 0.172), embolization/thrombosis (p = 0.281), or pneumothorax (p = 0.856). | Nutritional risk correlated with death in the ICU after 28 days (p < 0.001). Rating: Good. |
© 2020 by the authors. Licensee MDPI, Basel, Switzerland. This article is an open access article distributed under the terms and conditions of the Creative Commons Attribution (CC BY) license (http://creativecommons.org/licenses/by/4.0/).
Share and Cite
Silva, D.F.O.; Lima, S.C.V.C.; Sena-Evangelista, K.C.M.; Marchioni, D.M.; Cobucci, R.N.; Andrade, F.B.d. Nutritional Risk Screening Tools for Older Adults with COVID-19: A Systematic Review. Nutrients 2020, 12, 2956. https://doi.org/10.3390/nu12102956
Silva DFO, Lima SCVC, Sena-Evangelista KCM, Marchioni DM, Cobucci RN, Andrade FBd. Nutritional Risk Screening Tools for Older Adults with COVID-19: A Systematic Review. Nutrients. 2020; 12(10):2956. https://doi.org/10.3390/nu12102956
Chicago/Turabian StyleSilva, David Franciole Oliveira, Severina Carla Vieira Cunha Lima, Karine Cavalcanti Mauricio Sena-Evangelista, Dirce Maria Marchioni, Ricardo Ney Cobucci, and Fábia Barbosa de Andrade. 2020. "Nutritional Risk Screening Tools for Older Adults with COVID-19: A Systematic Review" Nutrients 12, no. 10: 2956. https://doi.org/10.3390/nu12102956