Sufficient Thrombin Generation Despite 95% Hemodilution: An In Vitro Experimental Study

 , , ,
, , ,
Abstract
:1. Introduction
2. Experimental Section
3. Results
4. Discussion
5. Conclusions
Supplementary Materials
Author Contributions
Funding
Conflicts of Interest
References
- Oyeniyi, B.T.; Fox, E.E.; Scerbo, M.; Tomasek, J.S.; Wade, C.E.; Holcomb, J.B. Trends in 1029 trauma deaths at a level 1 trauma center: Impact of a bleeding control bundle of care. Injury 2017, 48, 5–12. [Google Scholar] [CrossRef] [PubMed] [Green Version]
- Maegele, M.; Lefering, R.; Yucel, N.; Tjardes, T.; Rixen, D.; Paffrath, T.; Simanski, C.; Neugebauer, E.; Bouillon, B. Early coagulopathy in multiple injury: An analysis from the German Trauma Registry on 8724 patients. Injury 2007, 38, 298–304. [Google Scholar] [CrossRef] [PubMed]
- Frith, D.; Brohi, K. The pathophysiology of trauma-induced coagulopathy. Curr. Opin. Crit. Care 2012, 18, 631–636. [Google Scholar] [CrossRef] [PubMed]
- Chang, R.; Cardenas, J.C.; Wade, C.E.; Holcomb, J.B. Advances in the understanding of trauma-induced coagulopathy. Blood 2016, 128, 1043–1049. [Google Scholar] [CrossRef] [Green Version]
- Cap, A.; Hunt, B.J. The pathogenesis of traumatic coagulopathy. Anaesthesia 2015, 70, 96–101. [Google Scholar] [CrossRef]
- Spahn, D.R.; Bouillon, B.; Cerny, V.; Duranteau, J.; Filipescu, D.; Hunt, B.J.; Komadina, R.; Maegele, M.; Nardi, G.; Riddez, L.; et al. The European guideline on management of major bleeding and coagulopathy following trauma: Fifth edition. Crit. Care 2019, 23, 98. [Google Scholar] [CrossRef] [Green Version]
- Chambers, L.A.; Chow, S.J.; Shaffer, L.E.T. Frequency and Characteristics of Coagulopathy in Trauma Patients Treated With a Low- or High-Plasma-Content Massive Transfusion Protocol. Am. J. Clin. Pathol. 2011, 136, 364–370. [Google Scholar] [CrossRef] [Green Version]
- McQuilten, Z.K.; Wood, E.M.; Bailey, M.; Cameron, P.A.; Cooper, D.J. Fibrinogen is an independent predictor of mortality in major trauma patients: A five-year statewide cohort study. Injury 2017, 48, 1074–1081. [Google Scholar] [CrossRef]
- Winearls, J.; Mitra, B.; Reade, M.C. Haemotherapy algorithm for the management of trauma-induced coagulopathy. Curr. Opin. Anaesthesiol. 2017, 30, 265–276. [Google Scholar] [CrossRef]
- Stein, P.; Kaserer, A.; Sprengel, K.; Wanner, G.A.; Seifert, B.; Theusinger, O.M.; Spahn, D.R. Change of transfusion and treatment paradigm in major trauma patients. Anaesthesia 2017, 72, 1317–1326. [Google Scholar] [CrossRef] [Green Version]
- Schöchl, H.; Maegele, M.; Voelckel, W. Fixed ratio versus goal-directed therapy in trauma. Curr. Opin. Anaesthesiol. 2016, 29, 234–244. [Google Scholar] [CrossRef] [PubMed]
- Schöchl, H.; Maegele, M.; Solomon, C.; Görlinger, K.; Voelckel, W. Early and individualized goal-directed therapy for trauma-induced coagulopathy. Scand. J. Trauma Resusc. Emerg. Med. 2012, 20, 15. [Google Scholar] [CrossRef] [PubMed] [Green Version]
- Schöchl, H.; Voelckel, W.; Schlimp, C.J. Management of traumatic haemorrhage—The European perspective. Anaesthesia 2015, 70, 102–107. [Google Scholar] [CrossRef] [PubMed]
- Gratz, J.; Güting, H.; Thorn, S.; Brazinova, A.; Görlinger, K.; Schäfer, N.; Schöchl, H.; Stanworth, S.; Maegele, M. Protocolised thromboelastometric-guided haemostatic management in patients with traumatic brain injury: A pilot study. Anaesthesia 2019, 74, 883–890. [Google Scholar] [CrossRef]
- Innerhofer, P.; Fries, D.; Mittermayr, M.; Innerhofer, N.; von Langen, D.; Hell, T.; Gruber, G.; Schmid, S.; Friesenecker, B.; Lorenz, I.H.; et al. Reversal of trauma-induced coagulopathy using first-line coagulation factor concentrates or fresh frozen plasma (RETIC): A single-centre, parallel-group, open-label, randomised trial. Lancet Haematol. 2017, 4, e258–e271. [Google Scholar] [CrossRef]
- Gonzalez, E.; Moore, E.E.; Moore, H.B.; Chapman, M.P.; Chin, T.L.; Ghasabyan, A.; Wohlauer, M.V.; Barnett, C.C.; Bensard, D.D.; Biffl, W.L.; et al. Goal-directed Hemostatic Resuscitation of Trauma-induced Coagulopathy. Ann. Surg. 2016, 263, 1051–1059. [Google Scholar] [CrossRef]
- Schöchl, H.; Nienaber, U.; Maegele, M.; Hochleitner, G.; Primavesi, F.; Steitz, B.; Arndt, C.; Hanke, A.; Voelckel, W.; Solomon, C. Transfusion in trauma: Thromboelastometry-guided coagulation factor concentrate-based therapy versus standard fresh frozen plasma-based therapy. Crit. Care 2011, 15, R83. [Google Scholar] [CrossRef] [Green Version]
- van den Brink, D.P.; Wirtz, M.R.; Neto, A.S.; Schöchl, H.; Viersen, V.; Binnekade, J.; Juffermans, N.P. Effectiveness of prothrombin complex concentrate for the treatment of bleeding: A systematic review and meta-analysis. J. Thromb. Haemost. 2020, 18, 2457–2467. [Google Scholar] [CrossRef]
- Al Dieri, R.; Peyvandi, F.; Santagostino, E.; Giansily, M.; Mannucci, P.M.; Schved, J.; Béguin, S.; Hemker, H. The Thrombogram in Rare Inherited Coagulation Disorders: Its Relation to Clinical Bleeding. Thromb. Haemost. 2002, 88, 576–582. [Google Scholar] [CrossRef] [Green Version]
- Schäfer, N.; Driessen, A.; Bauerfeind, U.; Fröhlich, M.; Ofir, J.; Stürmer, E.K.; Maegele, M. In vitro effects of different sources of fibrinogen supplementation on clot initiation and stability in a model of dilutional coagulopathy. Transfus. Med. 2016, 26, 373–380. [Google Scholar] [CrossRef]
- He, S.; Johnsson, H.; Zabczyk, M.; Hultenby, K.; Wallen, H.; Blombäck, M. Fibrinogen depletion after plasma-dilution: Impairment of proteolytic resistance and reversal via clotting factor concentrates. Thromb. Haemost. 2014, 111, 417–428. [Google Scholar] [CrossRef] [PubMed] [Green Version]
- Ninivaggi, M.; Feijge, M.; Baaten, C.; Kuiper, G.; Marcus, M.; ten Cate, H.; Lancé, M.; Heemskerk, J.; van der Meijden, P. Additive roles of platelets and fibrinogen in whole-blood fibrin clot formation upon dilution as assessed by thromboelastometry. Thromb. Haemost. 2014, 111, 447–457. [Google Scholar] [CrossRef] [PubMed] [Green Version]
- Kozek-Langenecker, S.A.; Ahmed, A.B.; Afshari, A.; Albaladejo, P.; Aldecoa, C.; Barauskas, G.; De Robertis, E.; Faraoni, D.; Filipescu, D.C.; Fries, D.; et al. Management of severe perioperative bleeding. Eur. J. Anaesthesiol. 2017, 34, 332–395. [Google Scholar] [CrossRef] [PubMed] [Green Version]
- Morrison, G.A.; Koch, J.; Royds, M.; McGee, D.; Chalmers, R.T.A.; Anderson, J.; Nimmo, A.F. Fibrinogen concentrate vs. fresh frozen plasma for the management of coagulopathy during thoraco-abdominal aortic aneurysm surgery: A pilot randomised controlled trial. Anaesthesia 2019, 74, 180–189. [Google Scholar] [CrossRef] [PubMed]
- Hasan, S.; Abuelkasem, E.; Williams, B.; Henderson, R.; Mazzeffi, M.A.; Tanaka, K.A. Factor IX from prothrombin complex concentrate augments low dose tissue factor-triggered thrombin generation in vitro. Br. J. Anaesth. 2018, 121, 936–943. [Google Scholar] [CrossRef] [PubMed] [Green Version]
- Dunbar, N.M.; Chandler, W.L. Thrombin generation in trauma patients. Transfusion 2009, 49, 2652–2660. [Google Scholar] [CrossRef] [PubMed]
- Tanaka, K.A.; Mazzeffi, M.A.; Strauss, E.R.; Szlam, F.; Guzzetta, N.A. Computational simulation and comparison of prothrombin complex concentrate dosing schemes for warfarin reversal in cardiac surgery. J. Anesth. 2016, 30, 369–376. [Google Scholar] [CrossRef] [PubMed]
- Schöchl, H.; Voelckel, W.; Maegele, M.; Kirchmair, L.; Schlimp, C.J. Endogenous thrombin potential following hemostatic therapy with 4-factor prothrombin complex concentrate: A 7-day observational study of trauma patients. Crit. Care 2014, 18, 1–12. [Google Scholar] [CrossRef] [Green Version]
- Gangloff, C.; Mingant, F.; Theron, M.; Galinat, H.; Grimault, O.; Ozier, Y.; Pichavant-Rafini, K. New considerations on pathways involved in acute traumatic coagulopathy: The thrombin generation paradox. World J. Emerg. Surg. 2019, 14, 57. [Google Scholar] [CrossRef] [Green Version]
- Park, M.S.; Xue, A.; Spears, G.M.; Halling, T.M.; Ferrara, M.J.; Kuntz, M.M.; Dhillon, S.K.; Jenkins, D.H.; Harmsen, W.S.; Ballman, K.V.; et al. Thrombin generation and procoagulant microparticle profiles after acute trauma. J. Trauma Acute Care Surg. 2015, 79, 726–731. [Google Scholar] [CrossRef] [Green Version]
- Voils, S.A.; Lemon, S.J.; Jordan, J.; Riley, P.; Frye, R. Early thrombin formation capacity in trauma patients and association with venous thromboembolism. Thromb. Res. 2016, 147, 13–15. [Google Scholar] [CrossRef] [PubMed]
- Cardenas, J.C.; Rahbar, E.; Pommerening, M.J.; Baer, L.A.; Matijevic, N.; Cotton, B.A.; Holcomb, J.B.; Wade, C.E. Measuring thrombin generation as a tool for predicting hemostatic potential and transfusion requirements following trauma. J. Trauma Acute Care Surg. 2014, 77, 839–845. [Google Scholar] [CrossRef]
- Rattan, R.; Parreco, J.; Eidelson, S.A.; Gold, J.; Dharmaraja, A.; Zakrison, T.L.; Dante Yeh, D.; Ginzburg, E.; Namias, N. Hidden burden of venous thromboembolism after trauma. J. Trauma Acute Care Surg. 2018, 85, 899–906. [Google Scholar] [CrossRef] [PubMed]
- Park, M.S.; Spears, G.M.; Bailey, K.R.; Xue, A.; Ferrara, M.J.; Headlee, A.; Dhillon, S.K.; Jenkins, D.H.; Zietlow, S.P.; Harmsen, W.S.; et al. Thrombin generation profiles as predictors of symptomatic venous thromboembolism after trauma. J. Trauma Acute Care Surg. 2017, 83, 381–387. [Google Scholar] [CrossRef]
- Gratz, J.; Ponschab, M.; Iapichino, G.E.; Schlimp, C.J.; Cadamuro, J.; Grottke, O.; Zipperle, J.; Oberladstätter, D.; Gabriel, C.; Ziegler, B.; et al. Comparison of fresh frozen plasma vs. coagulation factor concentrates for reconstitution of blood. Eur. J. Anaesthesiol. 2020, 37, 879–888. [Google Scholar] [CrossRef] [PubMed]
- Grottke, O.; Braunschweig, T.; Spronk, H.M.H.; Esch, S.; Rieg, A.D.; van Oerle, R.; ten Cate, H.; Fitzner, C.; Tolba, R.; Rossaint, R. Increasing concentrations of prothrombin complex concentrate induce disseminated intravascular coagulation in a pig model of coagulopathy with blunt liver injury. Blood 2011, 118, 1943–1951. [Google Scholar] [CrossRef]
- Goldstein, J.N.; Refaai, M.A.; Milling, T.J.J.; Lewis, B.; Goldberg-Alberts, R.; Hug, B.A.; Sarode, R. Four-factor prothrombin complex concentrate versus plasma for rapid vitamin K antagonist reversal in patients needing urgent surgical or invasive interventions: A phase 3b, open-label, non-inferiority, randomised trial. Lancet 2015, 385, 2077–2087. [Google Scholar] [CrossRef]
- Levy, J.H.; Douketis, J.; Steiner, T.; Goldstein, J.N.; Milling, T.J. Prothrombin Complex Concentrates for Perioperative Vitamin K Antagonist and Non–vitamin K Anticoagulant Reversal. Anesthesiology 2018, 129, 1171–1184. [Google Scholar] [CrossRef]
- Inaba, K.; Rizoli, S.; Veigas, P.V.; Callum, J.; Davenport, R.; Hess, J.; Maegele, M. 2014 Consensus conference on viscoelastic test–based transfusion guidelines for early trauma resuscitation. J. Trauma Acute Care Surg. 2015, 78, 1220–1229. [Google Scholar] [CrossRef] [Green Version]
- Grottke, O.; Honickel, M.; Braunschweig, T.; Reichel, A.; Schöchl, H.; Rossaint, R. Prothrombin Complex Concentrate-induced Disseminated Intravascular Coagulation Can Be Prevented by Coadministering Antithrombin in a Porcine Trauma Model. Anesthesiology 2019, 131, 543–554. [Google Scholar] [CrossRef] [Green Version]
- Ponschab, M.; Voelckel, W.; Pavelka, M.; Schlimp, C.J.; Schöchl, H. Effect of coagulation factor concentrate administration on ROTEM® parameters in major trauma. Scand. J. Trauma Resusc. Emerg. Med. 2015, 23, 84. [Google Scholar] [CrossRef] [Green Version]
- Scharbert, G.; Thaler, U.; Weilnböck, C.; Wetzel, L.; Kozek-Langenecker, S. Heparin-induced effects of prothrombin complex concentrates in thromboelastometry. Wien. Klin. Wochenschr. 2012, 124, 320–325. [Google Scholar] [CrossRef] [PubMed]
- Grottke, O.; Rossaint, R.; Henskens, Y.; van Oerle, R.; ten Cate, H.; Spronk, H.M.H. Thrombin Generation Capacity of Prothrombin Complex Concentrate in an In Vitro Dilutional Model. PLoS ONE 2013, 8, e64100. [Google Scholar] [CrossRef] [PubMed] [Green Version]
- Haas, T.; Fries, D.; Tanaka, K.A.; Asmis, L.; Curry, N.S.; Schöchl, H. Usefulness of standard plasma coagulation tests in the management of perioperative coagulopathic bleeding: Is there any evidence? Br. J. Anaesth. 2015, 114, 217–224. [Google Scholar] [CrossRef] [PubMed] [Green Version]
- Mann, K.G. Thrombin Formation. Chest 2003, 124, 4S–10S. [Google Scholar] [CrossRef]


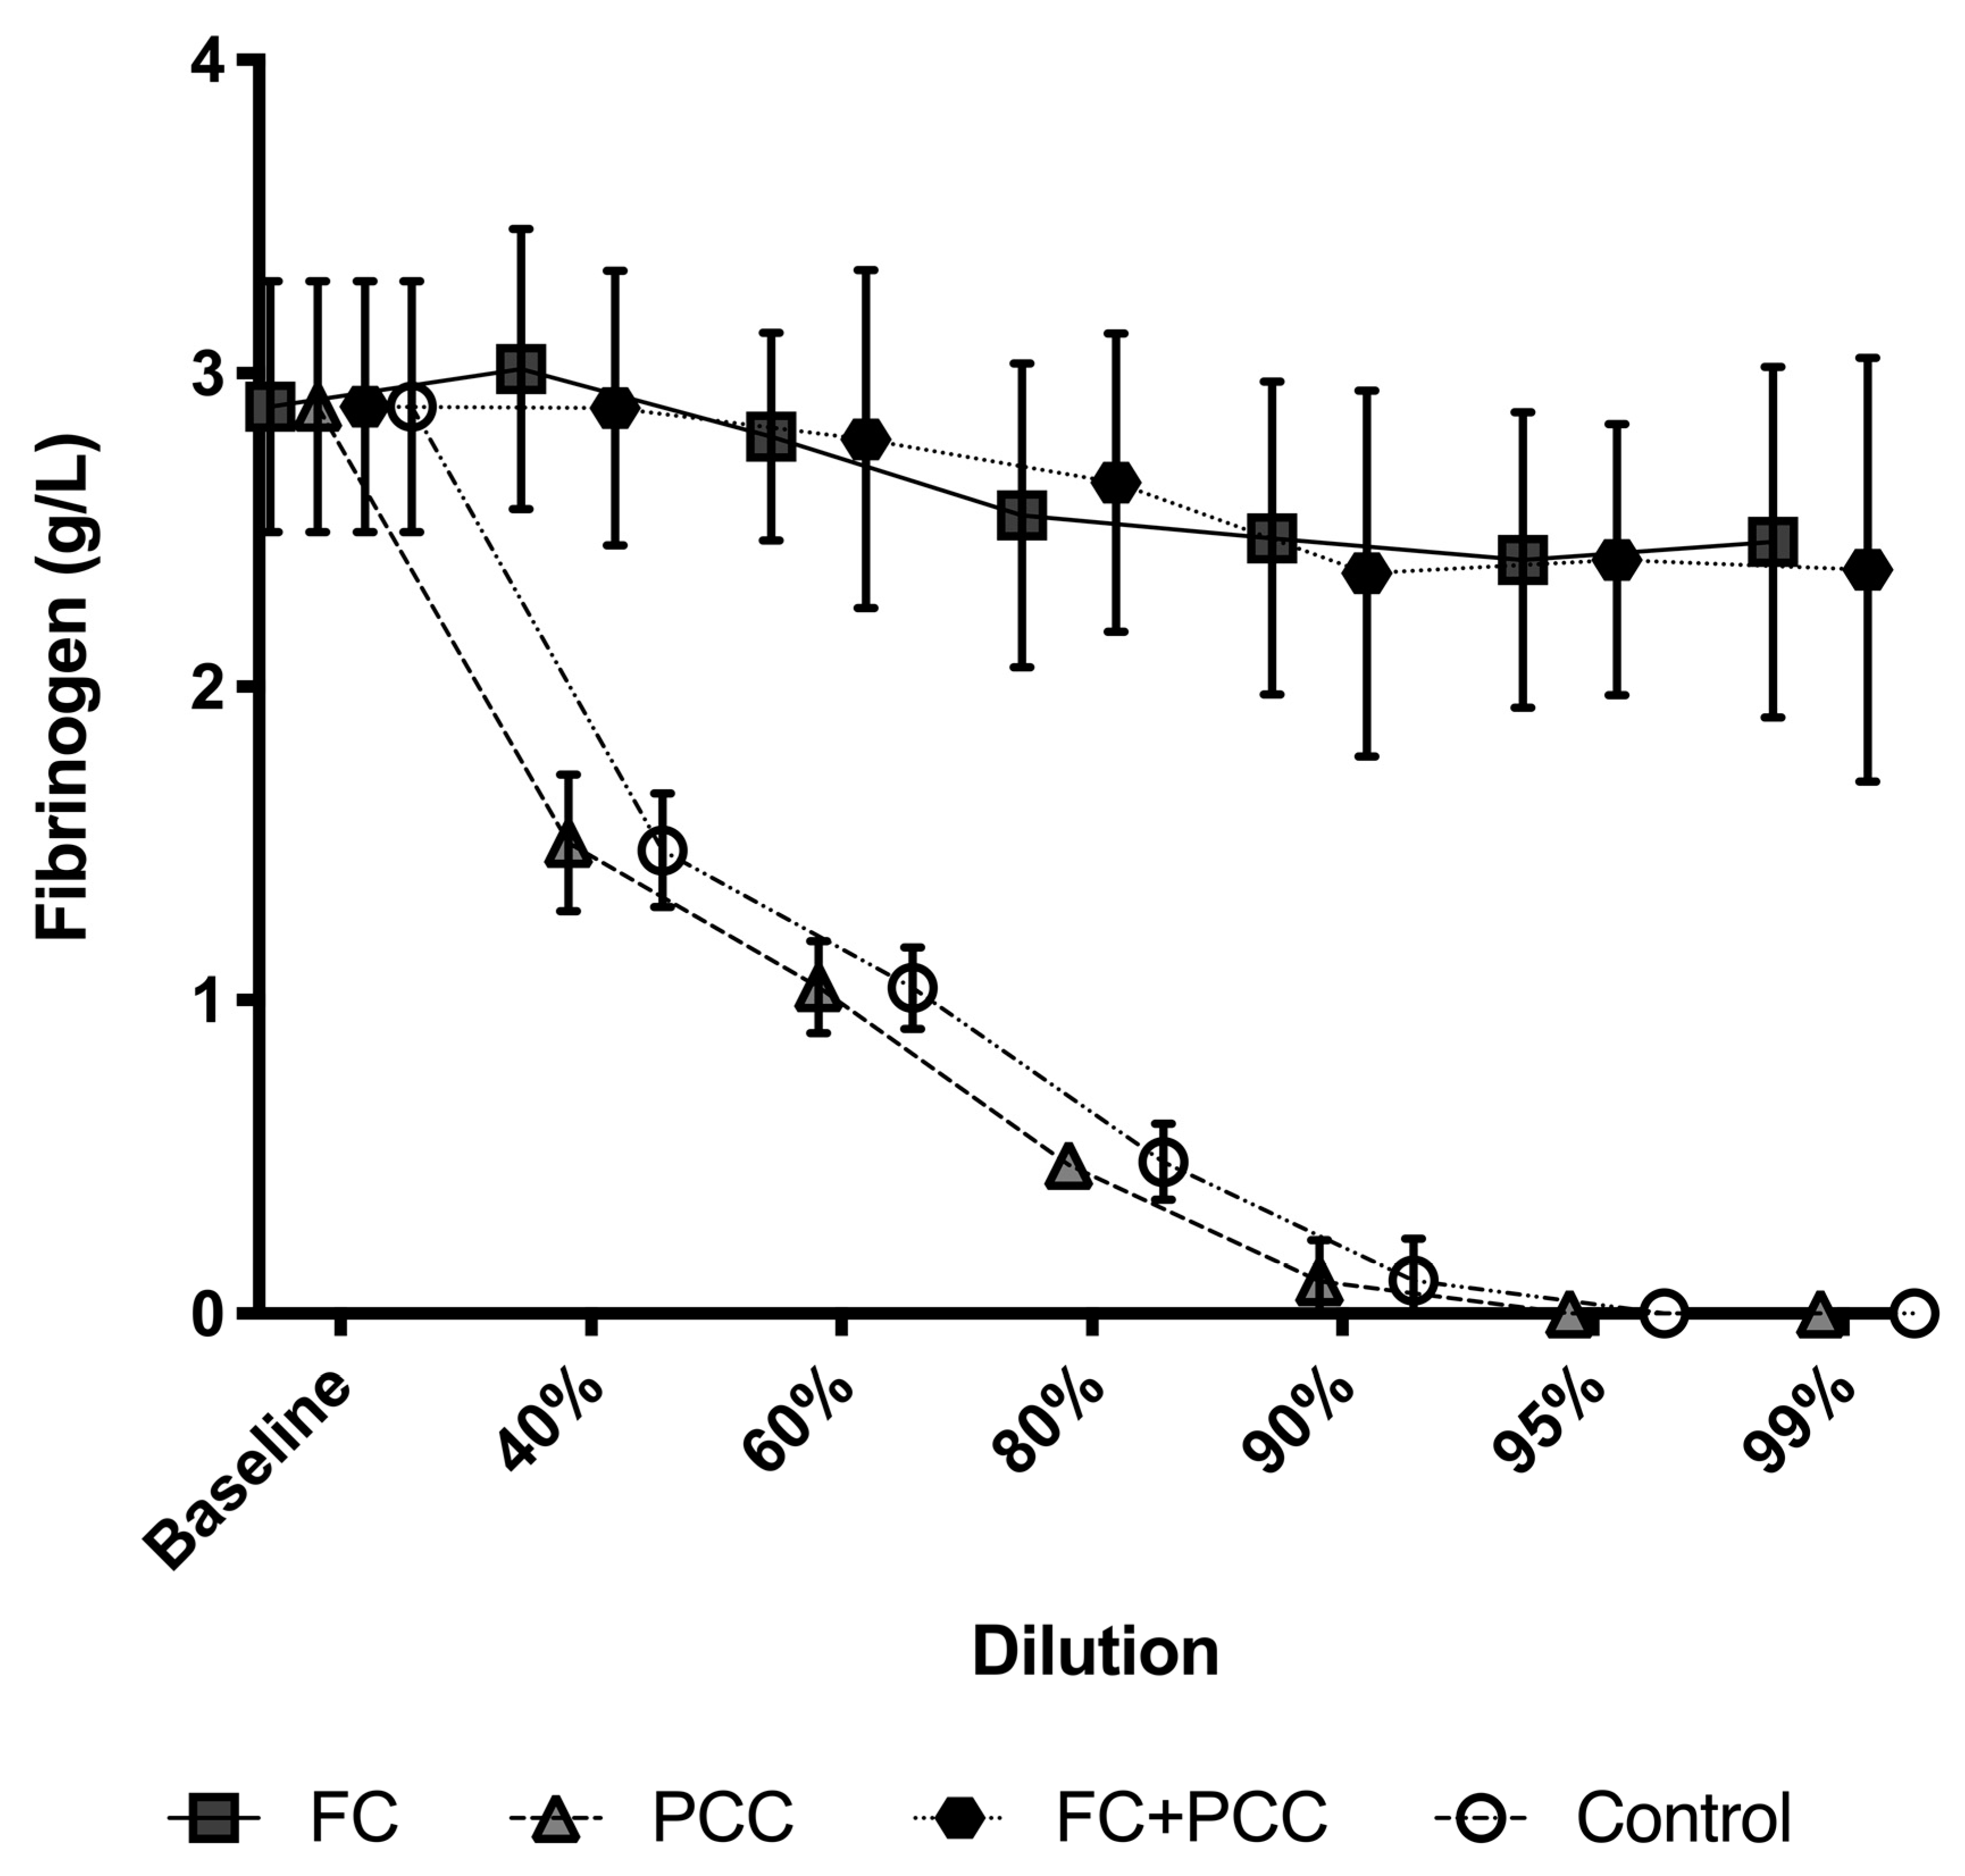
| Plasma coagulation tests | Fibrinogen; g/L | 2.9 (0.4) |
| Prothrombin time; seconds | 11.9 (2.1) | |
| Activated partial thromboplastin time; seconds | 34.9 (3.5) | |
| Factor II activity; % | 106 (4) | |
| Antithrombin activity; % | 107 (5) | |
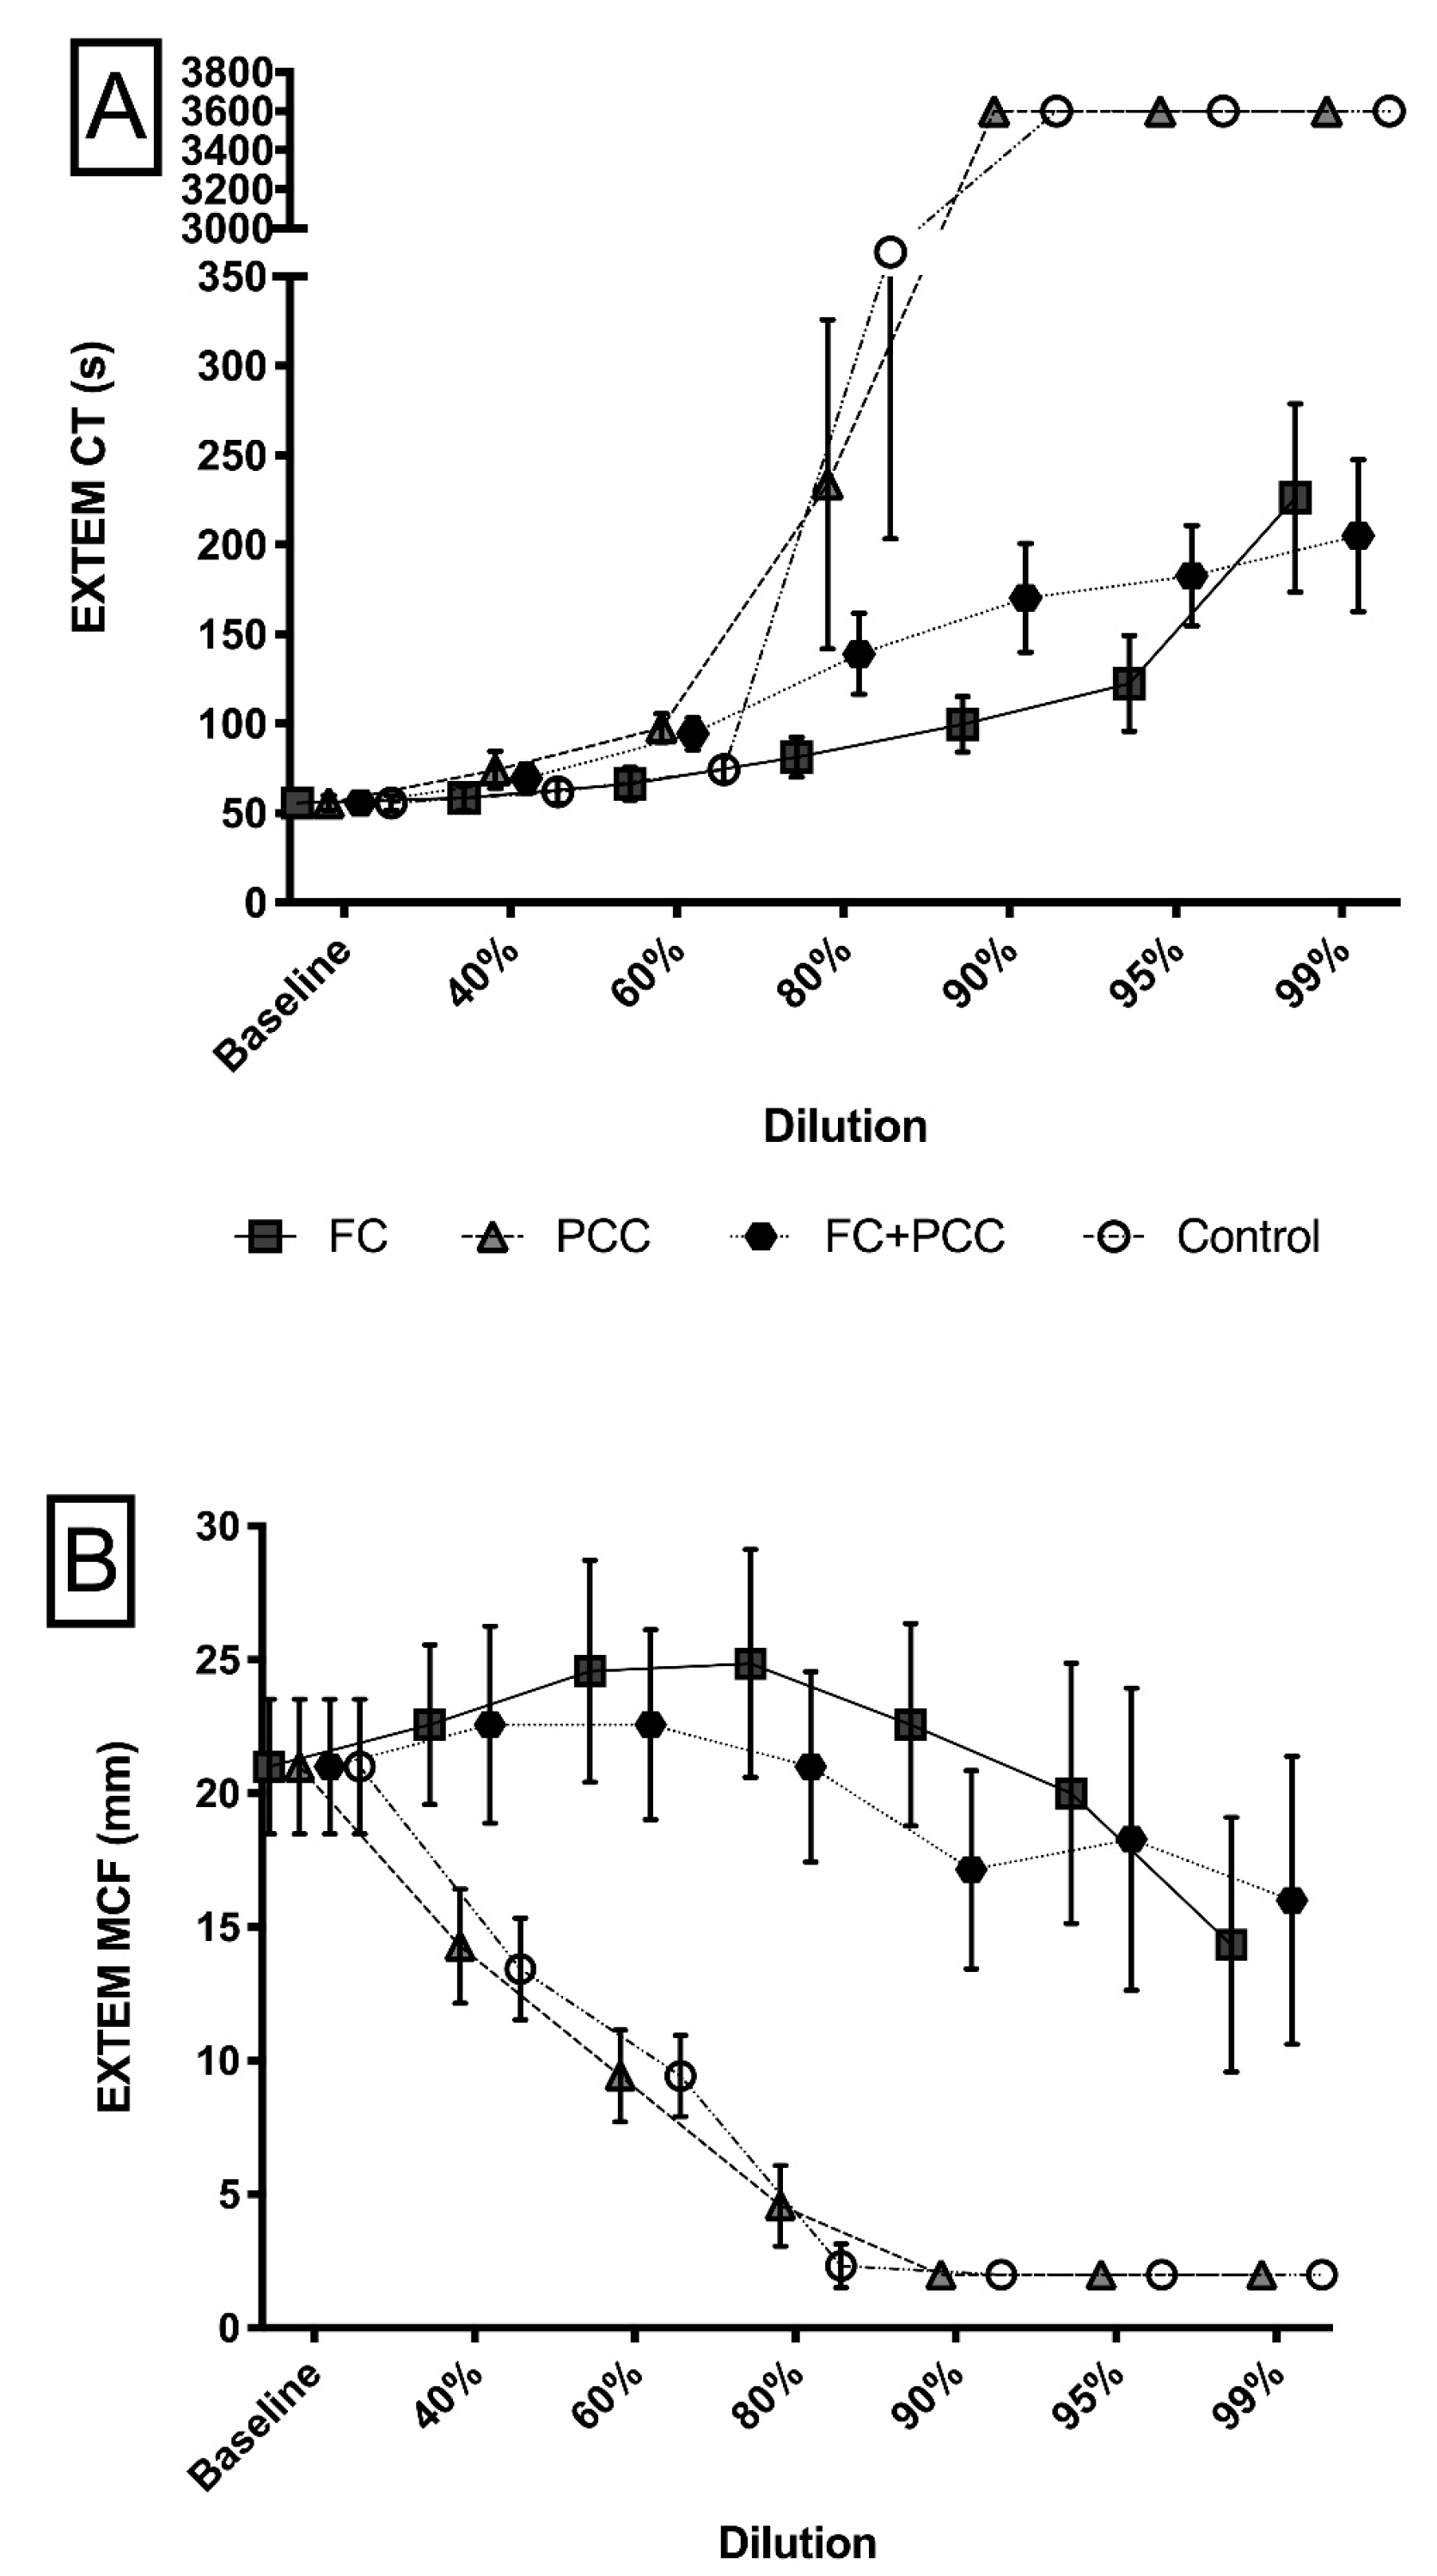
| ROTEM parameters | EXTEM CT; seconds | 55 (4) |
| EXTEM MCF; mm | 21 (3) | |
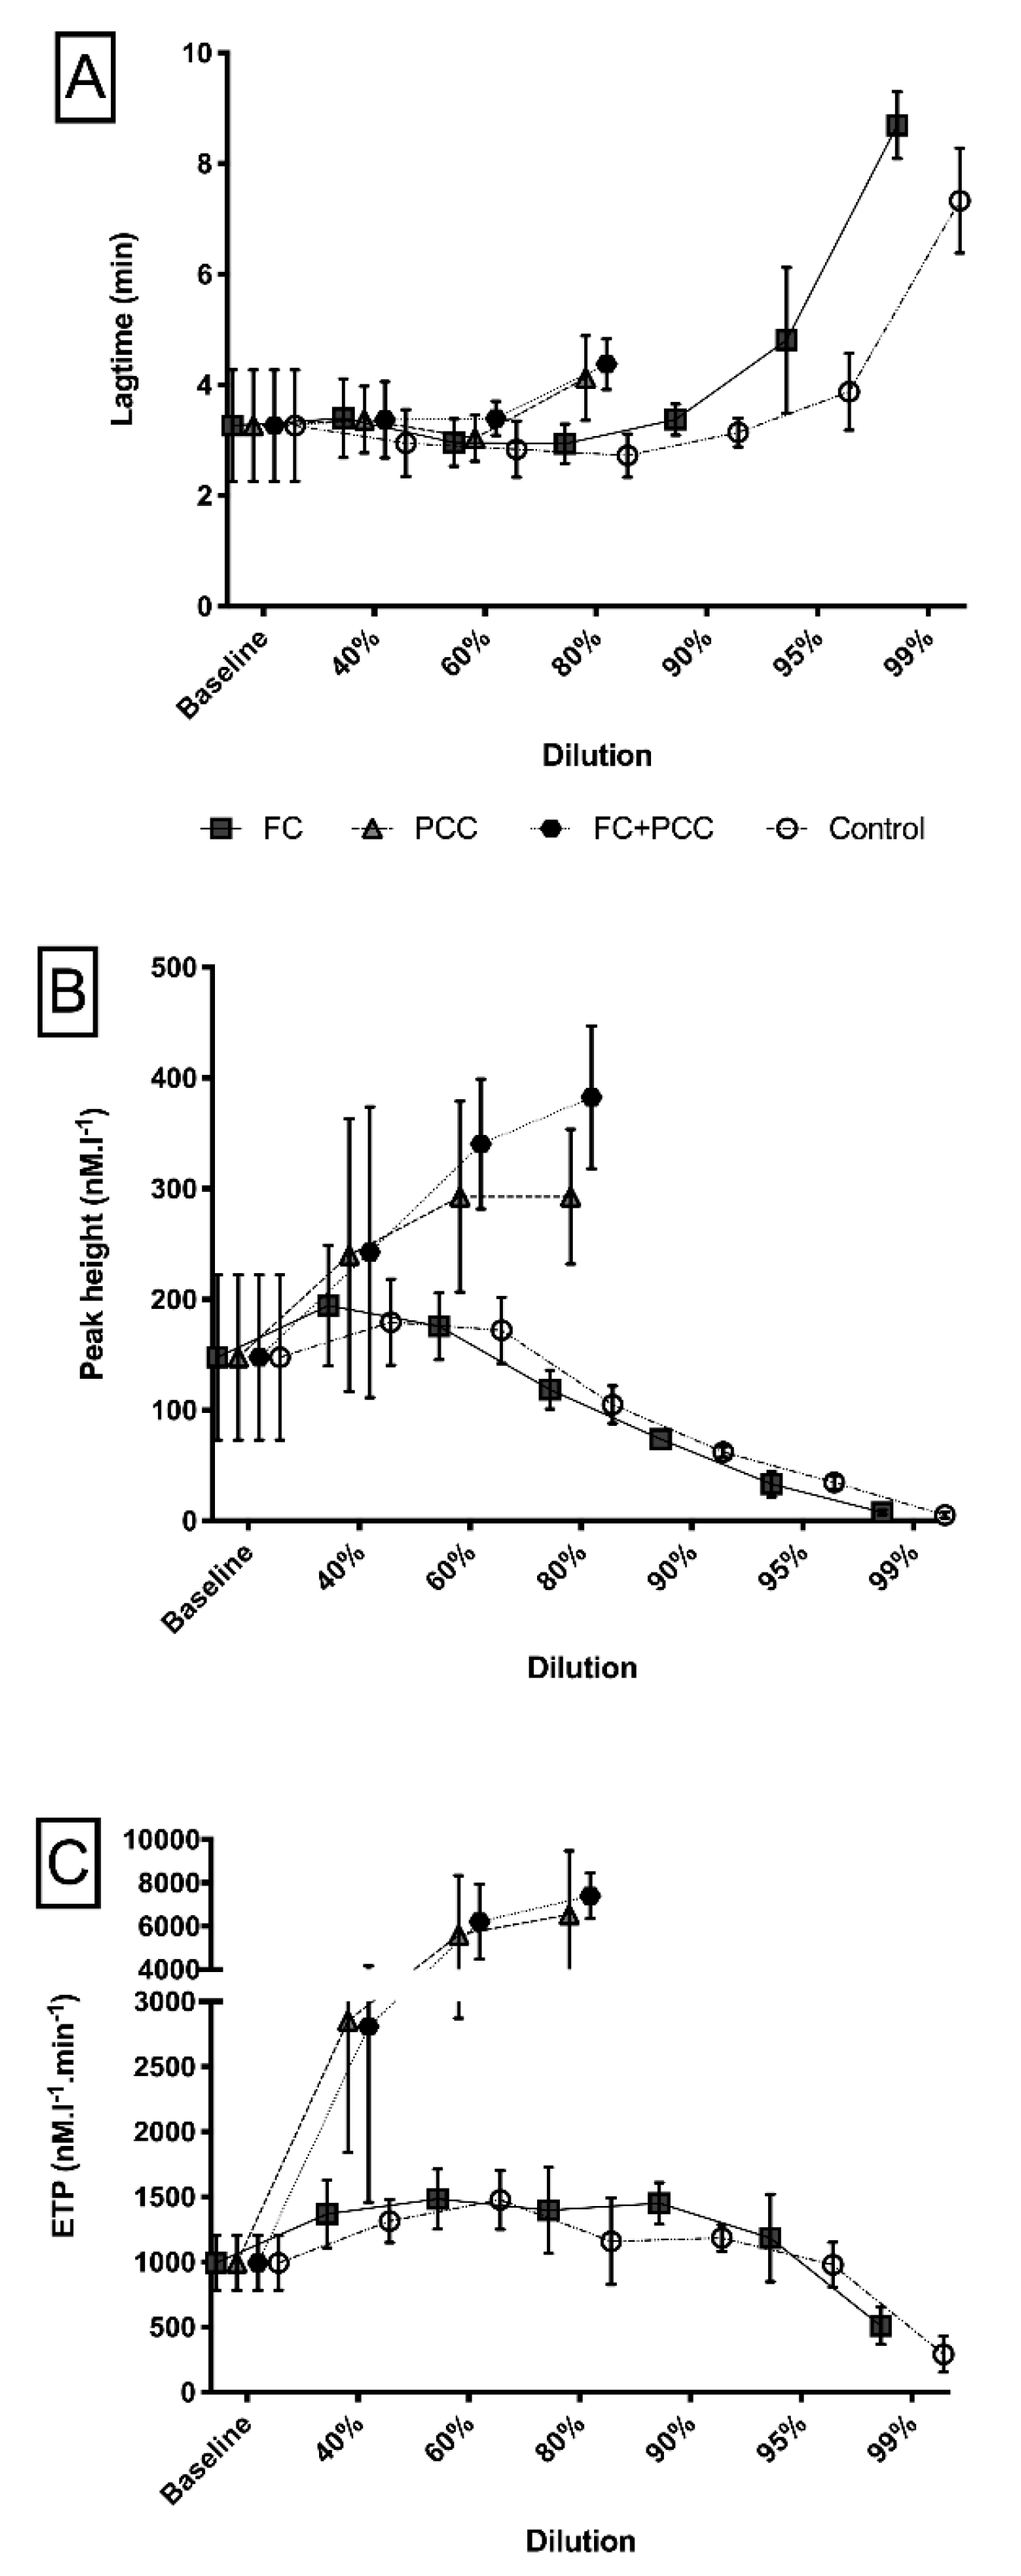
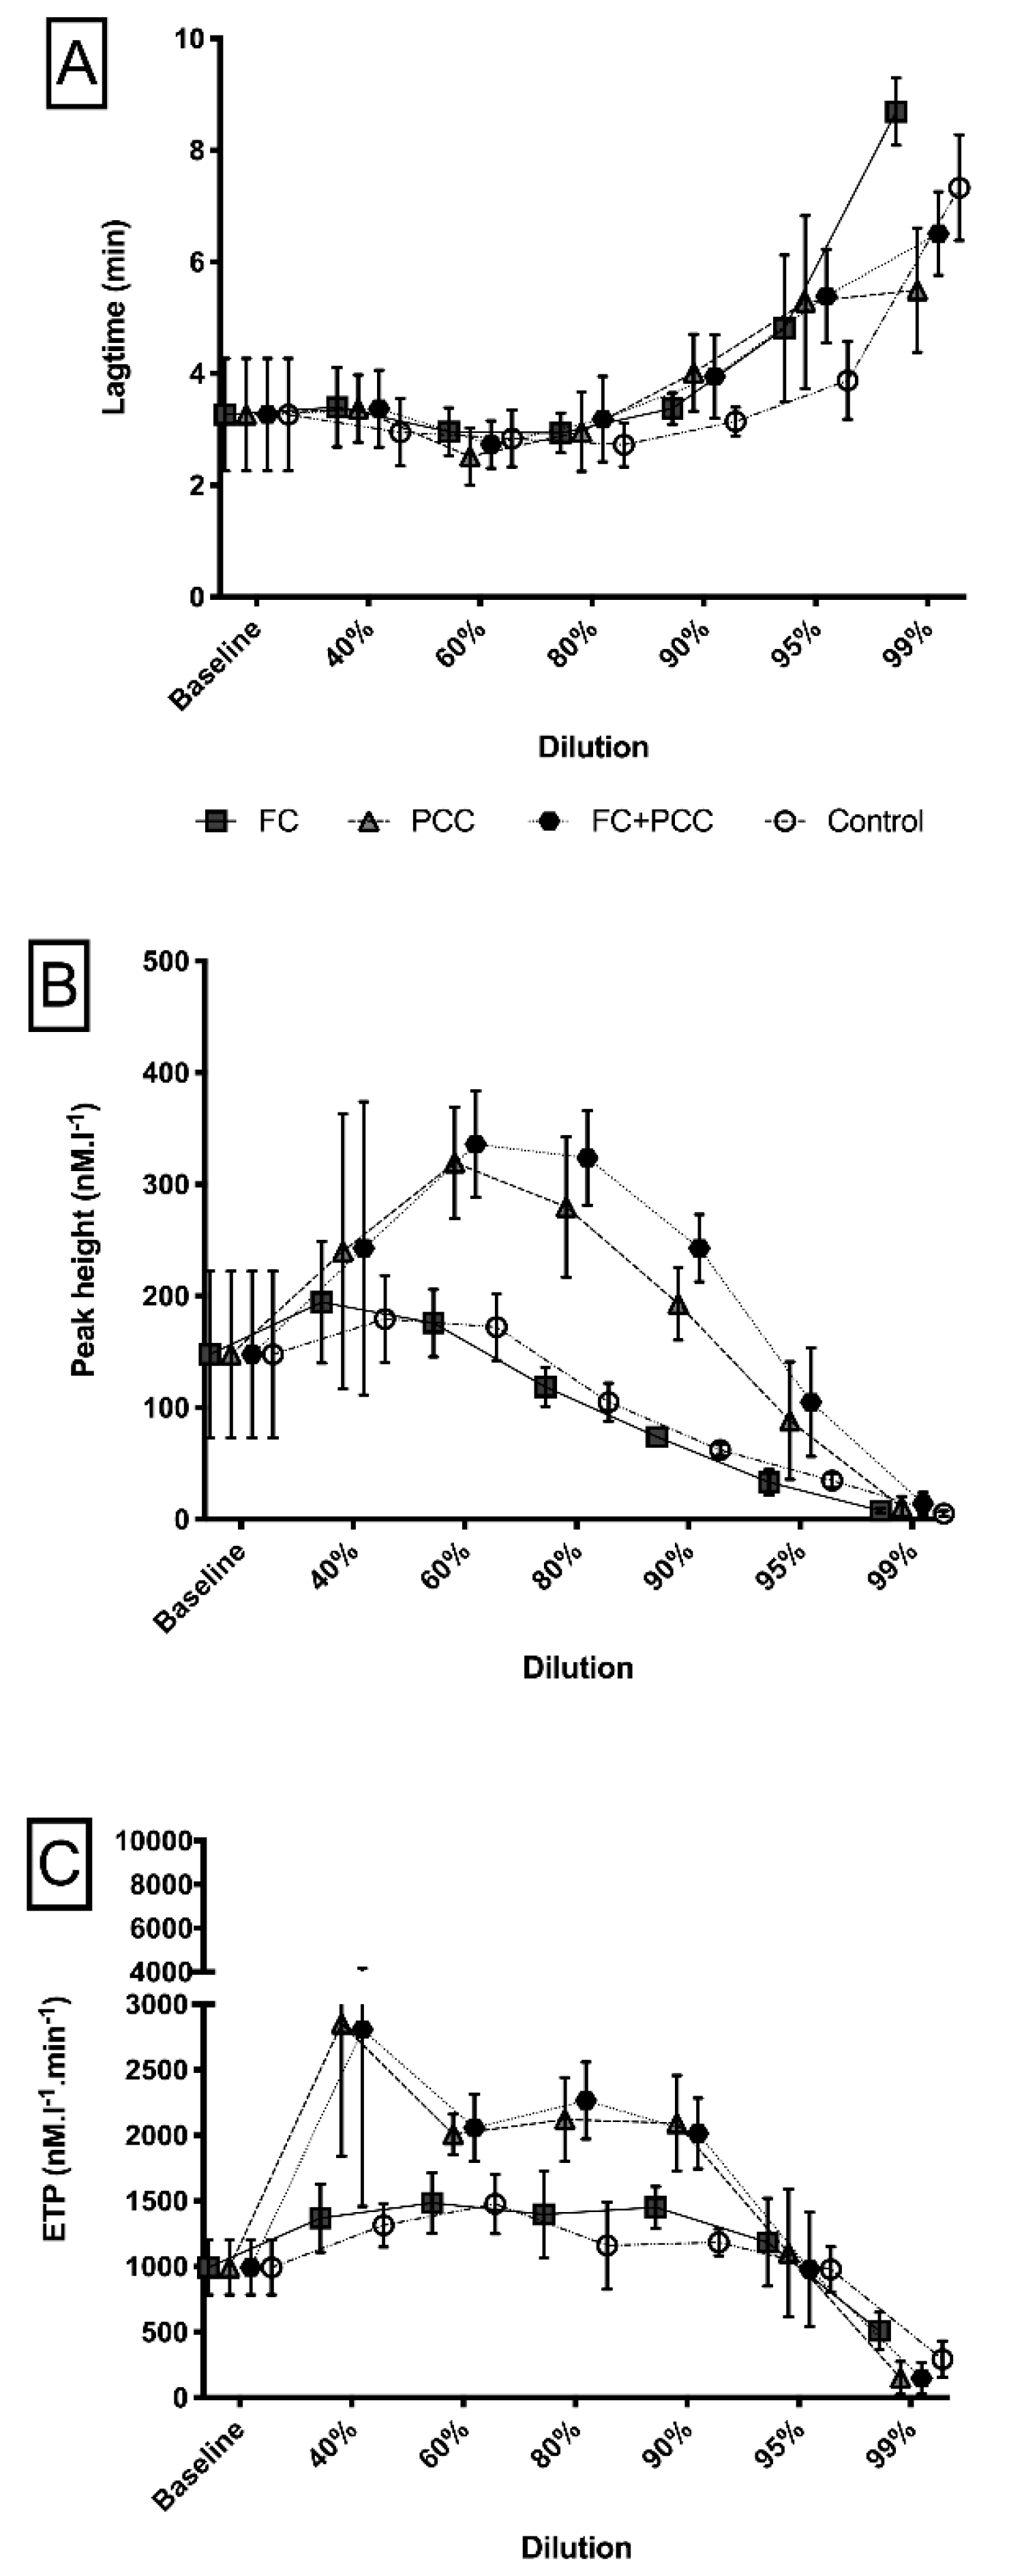
| Thrombin generation | Lag time; min | 3.3 (1.0) |
| Peak height; nM·L−1 | 148 (75) | |
| Endogenous thrombin potential; nM·L−1⋅min−1 | 993 (210) |
Publisher’s Note: MDPI stays neutral with regard to jurisdictional claims in published maps and institutional affiliations. |
© 2020 by the authors. Licensee MDPI, Basel, Switzerland. This article is an open access article distributed under the terms and conditions of the Creative Commons Attribution (CC BY) license (http://creativecommons.org/licenses/by/4.0/).
Share and Cite
Gratz, J.; Schlimp, C.J.; Honickel, M.; Hochhausen, N.; Schöchl, H.; Grottke, O. Sufficient Thrombin Generation Despite 95% Hemodilution: An In Vitro Experimental Study. J. Clin. Med. 2020, 9, 3805. https://doi.org/10.3390/jcm9123805
Gratz J, Schlimp CJ, Honickel M, Hochhausen N, Schöchl H, Grottke O. Sufficient Thrombin Generation Despite 95% Hemodilution: An In Vitro Experimental Study. Journal of Clinical Medicine. 2020; 9(12):3805. https://doi.org/10.3390/jcm9123805
Chicago/Turabian StyleGratz, Johannes, Christoph J. Schlimp, Markus Honickel, Nadine Hochhausen, Herbert Schöchl, and Oliver Grottke. 2020. "Sufficient Thrombin Generation Despite 95% Hemodilution: An In Vitro Experimental Study" Journal of Clinical Medicine 9, no. 12: 3805. https://doi.org/10.3390/jcm9123805