Article Text

Abstract
Objective To review the evidence for existing prognostic models in acute pulmonary embolism (PE) and determine how valid and useful they are for predicting patient outcomes.
Design Systematic review and meta-analysis.
Data sources OVID MEDLINE and EMBASE, and The Cochrane Library from inception to July 2014, and sources of grey literature.
Eligibility criteria Studies aiming at constructing, validating, updating or studying the impact of prognostic models to predict all-cause death, PE-related death or venous thromboembolic events up to a 3-month follow-up in patients with an acute symptomatic PE.
Data extraction Study characteristics and study quality using prognostic criteria. Studies were selected and data extracted by 2 reviewers.
Data analysis Summary estimates (95% CI) for proportion of risk groups and event rates within risk groups, and accuracy.
Results We included 71 studies (44 298 patients). Among them, 17 were model construction studies specific to PE prognosis. The most validated models were the PE Severity Index (PESI) and its simplified version (sPESI). The overall 30-day mortality rate was 2.3% (1.7% to 2.9%) in the low-risk group and 11.4% (9.9% to 13.1%) in the high-risk group for PESI (9 studies), and 1.5% (0.9% to 2.5%) in the low-risk group and 10.7% (8.8% to12.9%) in the high-risk group for sPESI (11 studies). PESI has proved clinically useful in an impact study. Shifting the cut-off or using novel and updated models specifically developed for normotensive PE improves the ability for identifying patients at lower risk for early death or adverse outcome (0.5–1%) and those at higher risk (up to 20–29% of event rate).
Conclusions We provide evidence-based information about the validity and utility of the existing prognostic models in acute PE that may be helpful for identifying patients at low risk. Novel models seem attractive for the high-risk normotensive PE but need to be externally validated then be assessed in impact studies.
- pulmonary embolism
- prognostic models
- prediction rules
- risk stratification
- systematic review
This is an Open Access article distributed in accordance with the Creative Commons Attribution Non Commercial (CC BY-NC 4.0) license, which permits others to distribute, remix, adapt, build upon this work non-commercially, and license their derivative works on different terms, provided the original work is properly cited and the use is non-commercial. See: http://creativecommons.org/licenses/by-nc/4.0/
Statistics from Altmetric.com
Strengths and limitations of this study
Comprehensive systematic review and meta-analysis of prognostic models in acute pulmonary embolism (PE) that was not restricted to only clinical prediction rules and derivation or validation studies, but was expanded to all available prediction/predictive models including update and impact studies to inform clinical decisions, with broad search strategy and predefined selection criteria, and no data or language restriction.
Study quality assessed by using prognostic criteria more appropriate than diagnostic tools for prognostic studies and by using a domain approach, and full details on study characteristics provided.
Quantitative analyses performed for ‘both stable and unstable PE’ and for ‘stable PE’, for each outcome/time point separately, and for every available risk cut-off for a model to assess how a model performs along the risk scale, and results provided in terms of summary estimates of proportion of risk groups and event rates within risk groups in ‘absolute risk’ more meaningful for clinicians and more appropriate for the study of prognosis, and summary estimates of sensitivity and specificity (accuracy).
Not included in the systematic review because they deserve specific reviews, studies performed in selective populations such as in asymptomatic PE, unstable PE, patients with cancer, elderly patients, or studies restricted to only a single risk group (low-risk or high-risk group) with the exception of impact studies.
Introduction
Venous thromboembolism (VTE), including pulmonary embolism (PE) and deep vein thrombosis (DVT), is a common and potentially fatal disorder, despite improvements in its management. The main short-term complications of PE are all-cause death, PE-related death, VTE events and bleeding.
In acute PE, there is a real clinical questioning and interest on how to choose the appropriate management for a specific patient.1–4 Usual care in the early phase is to treat patients in hospital and to use anticoagulants in normotensive patients or rescue thrombolysis in patients with hypotension or cardiogenic shock. In normotensive patients, other options are available that might depend on the estimated risk for adverse outcomes for the individual patient and include home treatment for patients at low risk, or closer monitoring and escalating therapy for patients at high risk.
Prognostic tools seek to classify patients by their risk of adverse outcomes to help select the appropriate management for an individual patient. The European Society of Cardiology 2008 guidelines1 suggest using the haemodynamic status based on systolic blood pressure (SBP) and signs of right ventricular dysfunction (RVD) and ischaemia. The American Heart Association (AHA) Scientific Statement2 considers that patients with low-risk stable PE with no prognostic markers of RVD/ischaemia ‘may still have significant rates of morbidity and mortality that are functions of older age and comorbidities’.
Systematic reviews of individual prognostic variables5–9 have shown inconsistent results across studies, leading to the development of prognostic models. The large number of studies of existing prognostic models and the differences between them suggest the need for a systematic review that could assess study quality, synthesise findings across studies, assess the validity of the original models and provide the best estimate from the model. Determining which prognostic models work, and which work best, may impact on clinical decisions and on research.
This systematic review assesses the characteristics and quality of studies of prognostic models in patients with acute PE. It investigates the performance and utility of the prognostic models, along their different phases of development in construction, validation, update and impact studies.
Methods
Selection criteria
Criteria for considering studies for this review were derived from previous reviews of prognostic models.10–13 To be eligible, studies had to have developed a prognostic model to predict the outcome of patients with an acute symptomatic PE, with the specific aim of constructing a new prognostic model or validating, updating or studying the impact of an existing one. The models needed to contain a combination of at least two prognostic variables to predict patient outcome, incorporated from across the following characteristics: demographic/clinical, biological and imaging related. Patient outcomes were death, PE-related death or VTE (DVT or PE) recurrence. Only hospital-based studies were considered for inclusion.
Prognostic studies validating individual prognostic indicators, population-based studies, studies performed in selective populations (asymptomatic PE, unstable PE, patients with cancer, elderly patients, specific risk group except when assessed in impact studies) or considering only surrogate outcomes were not included. As they include prognostic and practical variables for hospitalisation, checklists of exclusion criteria from early discharge or home treatment were not considered strictly prognostic. Thus, studies on safety of early discharge or home treatment based on these criteria were not included unless their objective was clearly to derive and validate the checklist or to compare it with existing prognostic models. Unpublished articles or those published only as conference abstracts, discussion articles on prognostic models or indicators or patient management were not included. If a study was published more than once, the first published article or the article combining cumulative results from different studies was included.
Search methods and search strategy
Studies were sought through electronic databases: OVID versions of MEDLINE and EMBASE, and The Cochrane Library, from inception to July 2014. Given that there are many conference presentations in this area, we corresponded with authors and further searched in Google Scholar and other databases to check for pending or recently published full articles. The search also covered various sources of ‘grey literature’ to identify published, unpublished and ongoing studies (see online supplementary protocol-S). Further searches included the reference lists of relevant articles and books, citation indexes and hand-search of issues in relevant journals. There were no date or language restrictions on the searches.
Supplemental material
The following Medical Subject Headings (MESH) terms and text words were used: pulmonary embolism.tw., exp Pulmonary Embolism/, exp Venous Thromboembolism/, prognos*.tw., exp Prognosis/, predict*.tw., cohort stud*.tw, exp Cohort Studies/, course.tw., exp Incidence/, score.tw., model*.tw., index.tw., rule.tw., criteria.tw., tool*.tw., severity index*.tw., geneva.tw., davies.tw. These were combined as shown in online supplementary box-s.
Data collection
Selection strategy
Potentially eligible studies were identified by examining titles and abstracts or other summaries as available. Full articles were obtained to assess eligibility criteria, before critical appraisal. Study identification was performed by two independent and blinded assessors to avoid selection bias. Disagreements were resolved through discussion.
Data extraction content
The data extraction form (online supplementary protocol-S) had six detailed sections: information about the review and verification of study eligibility, information about the study, assessment of study quality, assessment of methods relevant to the development phase of the model, general findings and results of model performance.
Data extraction management
An electronic data collection form was created in Excel. An explanation for the data extraction items was available in corresponding cells, but there were no coding instructions. Contents were adjusted throughout the data extraction process. Data were extracted by one reviewer and checked by a second reviewer to obtain reliable information on study findings and study methodology. Disagreements were resolved by discussion.
Dealing with missing data
Study investigators were contacted by email for details not reported in the published reports. A standard data collection form was used to assist with this, when needed.
Assessment of study quality
All studies were assessed for methodological quality10 ,13–18 and risk of bias in regard to study design, analysis and reporting according to predefined criteria for type of study, sample of patients (proper formation of inception cohort, description of referral pattern), adequacy of prognostic factors, adequacy of outcome measures, blind assessment of outcomes, completeness of follow-up, sample size, treatment, missing data and adjustment for all potential confounders (online supplementary protocol-S).
Summary scores were not used to identify studies of high quality or low quality,17 ,19 but ‘risk of bias’ figures were produced to show the findings graphically.
Data analysis
The descriptive analysis addressed reporting on type and phase of development of the model, study characteristics, population and setting patterns, patient characteristics, prognostic information, prognostic modelling and other data analyses, and study quality.
Quantitative analyses were performed at each relevant model risk cut-off level for various outcomes and time points. These used data from model validation and model update studies, with and without the results of the model construction study. Outcomes were all-cause mortality, PE-related mortality, VTE recurrence, major or clinically relevant bleeding and composite outcomes. These were assessed for the duration of hospitalisation, at 1 and at 3 months. Summary estimates and their 95% CIs were calculated for the population event rates, for the proportion of patients in risk categories and the incidence of events within risk categories, and were obtained as weighted average by the inverse variance method. When data were available from at least four studies, summary estimates of sensitivity and specificity and summary receiver operating characteristic (sROC) curves were obtained using the bivariate random-effects model.20 ,21
Studies that compared models either within the same article or in different articles or shared the same cohort in various model development phases were included once for the analysis of population event rates but as often as the number of prognostic models that were assessed for the analysis of risk group distribution, the incidence of events within risk groups and the prognostic performance of a model. Homogeneity of study designs, differences because of the case mix and statistical heterogeneity (Cochran's Q test, Higgins I2 statistic) were assessed to decide whether to combine the results of individual studies. When results were combined, a fixed-effects or a random-effects model was used depending on whether the effect was similar or variable across studies. The likely influence of the presence or absence of bias was examined in sensitivity analyses and funnel plots (observed and imputed studies, Egger's regression intercept). Subgroup analyses were performed for ‘stable’ and ‘both stable and unstable’ PE patient groups, ‘prospective’ or ‘retrospective’ studies and with regard to the phase of development (derivation, internal validation and external validation/update) of studies.
Analysis was performed using metandi22 and GLLAMM23 modules in Stata/SE (V.13.1), and using Comprehensive Meta-Analysis (CMA V.2. 2.064).
Data synthesis
To decide whether a prognostic model would be helpful for clinical practice, the following factors were required in external validation studies: direction and size of effect, and effect consistency across studies in the meta-analysis; and strength of evidence for the effect based on study quality and statistical measure of uncertainty.17 For a valid model to be acceptable, its utility should ideally have been demonstrated in an impact study, such as in a one-arm management study using the model or in a randomised trial comparing outcomes for patients in whom the model is used to inform decision-making and those for whom it is not used.
Results
Search results
Figure 1 shows the flow of studies through the review following Preferred Reporting Items for Systematic Reviews and Meta-Analyses (PRISMA) guidelines.24 The numbers of potentially relevant records identified and screened in each database were 3127 in MEDLINE, 5819 in EMBASE and 1000 in The Cochrane Library. Most of these were not eligible because they were clearly not relevant (2711, 5276 and 945, respectively) or because they did not meet selection criteria (328, 459 and 51, respectively). From 176 publications that were retained from these databases (88, 84 and 4, respectively) and from 10 additional publications from other sources, 75 were removed as duplicate records that had been found in more than one database and 40 were excluded for various reasons (figure 1): unmet criteria,25–48 duplicate,49–52 selective population,53–56 journal club,57–59 comment letter,60 algorithm,61 long-term outcome,62 reliability study63 and very old variables in the model.64
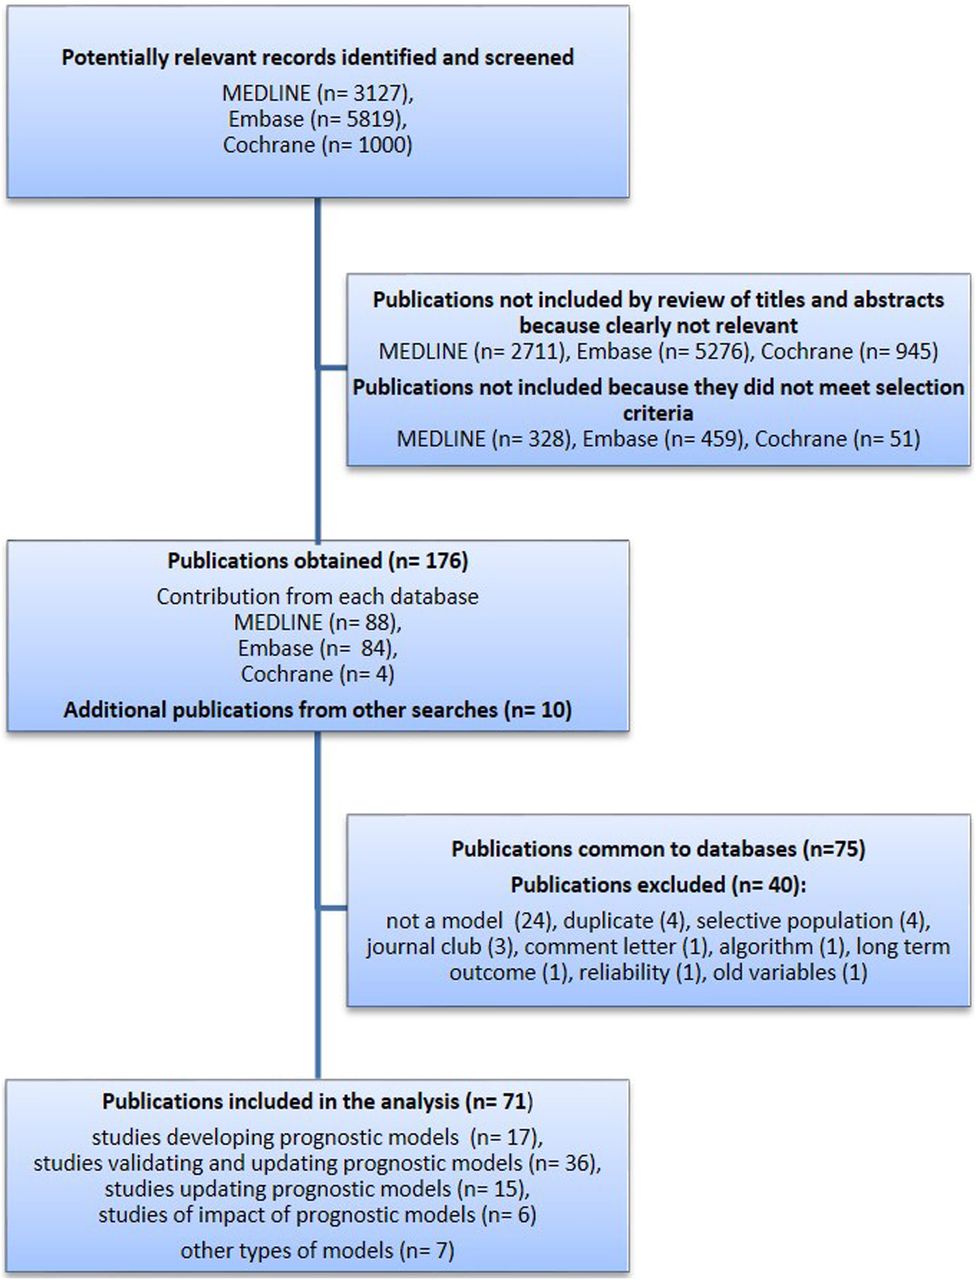
Flow chart of search results.
Finally, 71 studies were included in the review, 62 from databases65–126 and 9 from other sources that were mainly lists of references.127–135 Among studies included from databases, most were in MEDLINE and EMBASE, but four studies were not found in MEDLINE76 ,80 ,95 ,102 and one study was not in EMBASE.77 Two studies were identified in The Cochrane Library,71 ,100 but these were also found in MEDLINE and EMBASE. Some studies were based on retrospective analysis of prospectively collected data from previous diagnostic studies,136–141 one137 of which was used in two model construction studies68 ,69 and two external validation studies.70 ,97
In total, among the 71 studies, 64 were found to be including variables specific to the domain of PE and its prognosis: 17 were identified as model construction studies,65 ,67–69 ,85 ,87 ,89 ,90 ,92 ,110 ,118 ,121–124 ,129 ,135 41 as model external validation or model update studies70 ,72 ,74–78 ,80–84 ,86 ,88 ,91 ,93–97 ,99 ,101 ,102 ,104 ,106–109 ,111–117 ,119 ,120 ,127 ,130 ,131 ,134 and 6 as measuring model impact.66 ,71 ,100 ,128 ,132 ,133 For the remaining seven studies, variables in the model were either originally not specific to PE98 ,103 ,105 or to its prognosis73 or concerned a hospital checklist79 ,125 ,126 that is a combination of prognostic and practical variables for outpatient management.
Descriptive analysis
Prognostic models
We identified three types of models related to risk stratification of patients with PE (table 1 and see online supplementary table S1). Type 1 model includes variables specific to the domain and the prognosis of PE. Type 2 applies models that are used in other domains such as the Global Registry of Acute Coronary Events (GRACE)103 or the Charlson Comorbidity Index,98 ,105 or applies diagnostic prediction rules73 for the assessment of PE prognosis. Type 3 models incorporate hospital checklist variables as exclusion criteria from early discharge or home treatment.79 ,125 ,126
Variables used in the original prognostic models—prognostic variables included in the final models (only type 1 prognostic models presented) and points assigned (in numbers) to each variable when applied. Rule stands for scoring rule, score for simplified scoring rule or scoring system
Among the 17 ‘type 1’ prognostic models that were identified in model construction studies, 868 ,69 ,85 ,87 ,92 ,110 ,118 ,122 underwent external validation or were updated; some of them in many studies. Three68 ,118 ,122 were assessed in impact studies.71 ,100 ,128 There are two other models that were tested in impact studies,66 ,132 without being previously reported in a construction study. Table 1 shows that the variables that were mostly included in final models were in descending order: heart rate, active cancer, age, SBP, peripheral oxygen saturation and altered mental status.
Most of the studies identified for this review were external validation or update studies.
Study characteristics
Research objective, type of study and study design, setting, country, number of participating centres, patients (age, sex and haemodynamic status), outcomes, time points and corresponding event rates are displayed in online supplementary tables S2.1–S2.5.
In model construction studies (n=17) (see online supplementary table S2.1), the objective was usually to risk-stratify patients (13 studies) rather than to identify low-risk patients. Nine studies were prospective, seven reported on stable PE subgroup and seven were prospective and concerned stable PE as well. In 8 studies, patients were recruited in emergency departments (EDs) and in 13 studies, inception started on admission. Nine were multicenter studies. The PE Severity Index (PESI)68 and Prognostic Algorithm69 cohort included the largest derivation and internal validation sets, but the study was retrospective, had missing data and lack of information on PE diagnosis and on the type of treatment received. Four studies87 ,110 ,121 ,135 were sound methodologically and clinically relevant and present the following characteristics: prospective multicenter study, inception on admission, patients from ED, patients with stable PE reported, adequate early outcome and time point.
In model external validation studies (n=36) (see online supplementary table S2.2), the main objective was to identify low-risk patients. The other objectives were to assess added value of prognostic variables, head-to-head comparison or identification of patients with stable PE at high risk. Among the prospective studies (n=9) in stable and unstable PE, one study102 validated the European Society of Cardiology (ESC) model in terms of 30-day mortality and the other one compared Hestia checklist criteria with simplified PESI (sPESI) in terms of 7-day, 30-day and 3-month death; in stable PE, Geneva prognostic score (GPS),74 PESI,104 ,111 sPESI,80 ,101 ESC,72 ,80 FAST80 and eStiMaTe87 models were validated in seven studies, of which one study80 compared three models FAST, sPESI and ESC. Reliability was also assessed in two studies.75 ,106
Model update studies (n=15) (see online supplementary table S2.3) assessed the value of adding a two-test or a three-test strategy to PESI, based on a combination of RVD, cardiac troponin I (cTnI) and ultrasound (US)-detected DVT, to identify patients with high-risk PE;86 assessed the additive value of CT-RVD to Hestia,126 the additive value of transthoracic echocardiography (TTE)-RVD,111 brain natriuretic peptide (BNP)111 or cTnI to PESI,104 ,111 or TTE-RVD and BNP to Facteurs PRonostiques dans l'Embolie Pulmonaire (PREP),110 or the additive value of cardiac troponin T (cTnT),101 high-sensitive cTnT94 ,101 or N-terminal proBNP (NT-proBNP)95 to sPESI, in order to identify patients at lower risk or at higher risk; or assessed the effect of cause of death classification on sPESI whether combined or not to cTnI.109 Eight studies were prospective and specific to stable PE. Retrospective studies assessed the additive value of CT-RVD,112 of white cell count (WCC) and systemic inflammatory response syndrome (SIRS),89 of NT-proBNP, cTnI or CT-RVD77 to PESI; the additive value of cTn to PESI96 or to sPESI;115 and the additive value of TTE-RVD to Shock Index.117
Six studies measured model impact (see online supplementary table S2.4). Four were performed in patients identified as low risk by the model, assessing the safety of early discharge or outpatient treatment. This was done in a one-arm management study for GPS128 and NT-proBNP,66 and in a randomised controlled trial (RCT) where outpatient management was compared with standard hospitalisation (inpatient treatment) either by using the Spanish model100 or by using PESI in the Outpatient Treatment of Pulmonary Embolism (OTPE) study.71 The Pulmonary EmbolIsm THrOmbolysis (PEITHO) randomised double-blind trial132 assessed the role of fibrinolytic therapy tenecteplase in normotensive patients with PE considered at intermediate–high risk by TTE-RVD or CT-RVD, and myocardial injury as indicated by a positive test for cTnI or cTnT. Another study assessed the use and the impact of model-based risk stratification on treatment decisions and outcome in clinical practice.133 All studies were multicenter and prospective except the latter, which was a single-centre and retrospective study.
Study quality
Quality of individual studies and a summary of study quality at different model development phases are shown in online supplementary figures S1.1 to S6.2.
Among model construction studies (see online supplementary figures S1.1 and S1.2), PREP,110 esTiMaTe87 and Bova's study135 models satisfied most of the study quality criteria. Criteria that were often met (in at least 70% of the included studies) are: inclusion criteria definition, characteristics description, length of follow-up and criteria about the outcome (objectiveness, full definition, appropriateness, proportion of patients with known outcome). Criteria that were least often met (in <30% of the included studies) are: sample completeness (selection bias), reasons for lost to follow-up reporting, similarity of outcome assessment for all study participants, differences with participants who did not complete the study, availability of prognostic variables and justification of sample size.
In model validation studies (see online supplementary figures S2.1 and S2.2), including those that also updated the model, the most recent validation studies87 ,101 ,102 ,111 satisfied most of the study quality criteria. The most often met criteria concerned specification of inclusion criteria, sample selection, population characteristics description, follow-up, outcome (objective, fully defined, appropriate, known for a high proportion of patients), and full definition of prognostic variables and description of treatment. Major concerns were about sample completeness, reporting on reasons for lost to follow-up and differences with participants who did not complete the study, justification of sample size and statistical analysis.
In model update studies (see online supplementary figures s3.1 and s3.2), three studies95 ,101 ,111 satisfied most of the criteria. The summary of study quality shows that most of the criteria were often met, but there are concerns about sample completeness and reporting on reasons for lost to follow-up and differences with participants who did not end the study, justification of sample size and how lost to follow-up treated.
Model impact studies (see online supplementary figures S4.1 and S4.2) had the best compliance with study quality criteria, with most of the key factors provided.66 ,71 ,100 ,132
For type 2 and 3 studies, the number of studies is too small to draw general conclusions. In type 2 studies (see online supplementary figures S5.1 and S5.2), although inclusion was well defined, there are problems with sample selection and sample completeness in all98 ,103 ,105 but one study,73 in justification of sample size and data analysis. In type 3 studies (see online supplementary figures S6.1 and S6.2), the main concerns are about a lack of information on reasons for lost to follow-up, justification of sample size and data analysis (missing data, lost to follow-up, statistical adjustment).
Quantitative analysis
Population event rates
There were a total of 44 298 patients if patients in the cohorts account once, only regardless of how many studies reported those patients, and if impact studies that involved only low-risk or intermediate-risk patients are excluded.
Analysis based on inverse-variance method with random-effects model (see online supplementary table S3) showed overall in-hospital, 30-day and 3-month point estimate to be 6.5% (95% CI 4.9% to 8.5%) (20 studies), 7.4% (6.5% to 8.5%) (32 studies) and 6.8% (5.7% to 8.1%) (11 studies), respectively, for mortality; 3.1% (2.6% to 3.8%) (7 studies), 4.0% (3.2% to 5.0%) (15 studies) and 2.9% (2.2% to 3.7%) (6 studies), respectively, for PE-related mortality; and 0.2% (0.0% to 1.5%) (3 studies), 1.1% (0.7% to 1.8%) (6 studies) and 2.6% (1.6% to 4.4%) (4 studies), respectively, for VTE recurrence. Composite event rates, major and non-major clinically relevant bleeding and fatal bleeding are also displayed.
Risk groups
All-cause mortality
The distribution of risk groups for a model (proportion of patients in low-risk or in high-risk groups) according to specified cut-off levels and the incidence of all-cause mortality within risk groups, expressed in % (95% CI), are shown in detail (table 2). The following paragraphs summarise the findings.
In-hospital, 30-day and 3-month all-cause mortality, and distribution of risk groups for relevant risk cut-offs
For GPS≥3 vs GPS≤2 cut-off, mortality was reported only in a single external validation study; the prevalence of the low-risk group is 82% (77.3% to 85.9%), and the incidence of 30-day mortality in the low-risk group is 9.8% (3.2% to 26.6%). The prevalence of high-risk group is 18% (14.1% to 22.7%) and the incidence of 30-day mortality is 20.1% (11.4% to 33%).
For PESI≥III vs PESI≤II cut-off, the overall prevalence of low-risk group is 43.1% (39.6% to 46.6%) and the overall in-hospital, 30-day and 3-month mortality rates within low-risk group are 1.4% (1.2% to 1.8%) (5 studies), 2.3% (1.7% to 2.9%) (9 studies) and 1% (0.5% to 1.8%) (6 validation studies), respectively. The overall prevalence of high-risk patients is 56.9% (53.4% to 60.4%) and the overall in-hospital, 30-day and 3-month mortality rates are 9.3% (8.4% to 10.4%), 11.4% (9.9% to 13.1%) and 13.0% (8.7% to 18.9%), respectively. Summary estimate of the prevalence and the mortality rates from external validation studies are consistent with those of the derivation and internal validation samples.
For sPESI, the overall prevalence of low-risk group is 36.3% (33.3% to 39.4%). The overall in-hospital, 30-day and 3-month mortality rates are 0.3% (0% to 2.3%) (2 external validation studies), 1.5% (0.9% to 2.5%) (11 studies) and 0.8% (0.3% to 2.2%) (3 external validation studies), respectively. The overall proportion of high-risk patients is 63.7% (60.6% to 66.7%) and the overall in-hospital, 30-day and 3-month mortality rates are 3.2% (1.6% to 6.4%), 10.7% (8.8% to 12.9%) and 13.6% (8.8% to 20.3%), respectively. Results are consistent across derivation, internal validation and external validation samples.
With the algorithm (4 studies), 22% (19.3% to 24.9%) of patients are classified as low risk. The in-hospital and 30-day mortality rates are 0.6% (0.4% to 1%) and 1.1% (0.5% to 2.1%), respectively. The results in the validation and the derivation samples are similar.
For the PREP model (mortality reported in 1 external validation study), 67.2% (61.7% to 72.3%) of patients are classified as low risk. The 30-day and 3-month mortality rates are 1% (0.2% to 3.9%) and 1.5% (0.5% to 4.5%), respectively, in the low-risk group, and 7.1% (3.4% to 14.1%) and 9.1 (4.8 to 16.6), respectively, in the high-risk group. In the original study, the incidence of a 30-day composite outcome is 2.5% (1.2% to 4.9%), 37.3% (33.2% to 41.5%) of patients are classified as high risk and the incidence of events is 17.7% (12.9% to 23.8%).
Shock Index classifies 80.3% (68% to 88.7%) of patients in the low-risk group, but with a high 30-day mortality rate of 10.7% (6.1% to 17.9%) and 24.1% (13.6% to 39.1%) in the high-risk group.
With ESC, the low-risk group prevalence is 89.8% (72.7% to 96.7%); the in-hospital and 30-day mortality rates are 5% (3.6% to 7.1%) (3 studies) and 8.9% (4.7% to 16.5%) (1 study), respectively, in the low-risk group, and 41.1% (22.7% to 62.5%) and 26.5% (16.1% to 40.4%), respectively, in the high-risk group. These results apply for ‘both stable and unstable’ patients. For the stable PE patient subgroup, for ‘intermediate–high’ risk cut-off (intermediate–high-risk patients have RVD and myocardial injury, and the lower risk that includes intermediate–low-risk and low-risk groups either one of them or none), the proportion of the lower risk group is 74.4% (52.4% to 88.5%) (5 studies) and the in-hospital mortality rate is 3.1% (1.4% to 6.8%) in the lower risk group and 7.7% (4.7% to 12.2%) in the intermediate–high-risk group.
Given the high event rate within the ‘low-risk’ groups from Shock Index and ESC, these would not qualify as suitable for the identification of a low-risk but of a ‘high-risk’ patient group.
The performance of other models recently constructed is discussed in model update section.
Outcomes other than all-cause mortality
Tables 3 and 4 show summary estimates with results from studies that report outcomes in terms of PE-related death, adverse outcome (clinical deterioration, haemodynamic collapse), VTE and their combinations in ‘both stable and unstable’ (table 3), and separately in ‘stable’ (table 4) patient groups. Although many studies were retrospective or were single studies, the results confirm the predictive ability for PESI and sPESI at the optimal cut-offs or less, preferably in combination with biomarkers, for identifying patients at low risk for these specific outcomes as well, mainly in stable PE. They also confirm the ability for some models at higher cut-offs for identifying patients at very high risk (30-day event rate over 20%) such as PREP—Clin≥III without or with BNP—TTE-RVD, PESI≥IV, PESI V without or with TTE-RVD, ESC high, Shock Index, eStiMaTe high, FAST 3, Bova stage III. Most of the models combine biomarkers or imaging-based modalities to clinical variables or to pre-existing models. In most of the studies, the proportion of patients at very low or at very high risk is low.
PE-related death, adverse outcome (death, clinical deterioration or haemodynamic collapse), VTE, major bleeding and their combinations in ‘both stable and unstable’ PE patient risk groups
PE-related death, adverse outcome (death, clinical deterioration or haemodynamic collapse), VTE, major bleeding and their combinations in ‘stable’ PE patient risk groups
Type 2 and type 3 model studies
Table 5 shows the results of type 2 and type 3 model studies. Revised Geneva score73 (RGS) and simplified Geneva score73 (SGS) originally dedicated for the diagnosis of PE may provide at low cut-offs a small 3-month mortality rate (0.9% (0.1% to 12.3%)) in patients at low risk. Similarly, at the lowest cut-offs, GRACE ACS103 and GRACE PE103 risk scores show 1.3% (0.1% to 17.1%) and 1.1% (0.1% to 15.1%) 30-day mortality rate, respectively, within the low-risk patient groups. Of note is a large 95% CI for Geneva and GRACE scores due the small number of patients in the low-risk groups. Interestingly, the high event rates (23–30%) in the high-risk groups of GRACE scores whatever the cut-offs with a high proportion (49–81%) of patients in these risk groups. These models need to be validated in prospective studies with larger sample sizes in stable PE. Davies79 and Hestia125 ,126 checklists (table 5 and online supplementary table S2.5) show a high proportion of patients at low risk (42–55%) with a small 3-month mortality rate: 1.9% (0.4% to 5.5%) and 1.2% (0.4% to 3.7%), respectively. These models need to be compared with PESI/sPESI models in impact studies.
Studies reporting on derivation and external validation of models originally not specific to the prognosis or the domain of PE (type 2 model studies), and studies reporting on hospital criteria checklists (type 3 model studies)
Incidence of events along the risk scale
As expected, the event rates for different outcomes and time points increase along the risk scale. Tables 3–⇑5 and online supplementary table S4 show how the predicted outcomes in the derivation samples compare with the observed outcomes in the validation samples (internal, external) at different cut-offs for GPS and PESI. Shifting the cut-off to a lower level or to a higher level provides more appropriate event rates in low-risk groups and in high-risk groups, respectively, but at the expense of a decrease in the proportion of patients within these risk groups. Thus, improvement in efficacy is associated with a decline in efficiency.
Prognostic accuracy
Summary estimates are displayed (see online supplementary tables S5 and S6) for different cut-offs as identified in studies to discriminate between low-risk and high-risk groups. They are provided only when at least four studies are identified for a specific cut-off, and a specific outcome and time point. The highest overall sensitivity estimates were obtained with the Prognostic Algorithm (4 studies) for predicting in-hospital mortality (97% (96% to 98%)) and 30-day mortality (98% (96% to 99%)), followed by PESI (94% (89% to 97%)) for 3-month mortality (6 external validation studies) and by sPESI (93% (90% to 95%)) for 30-day (11 studies) and for 3-month mortality (10 external validation studies) (see online supplementary table S5). All results are consistent and similar in external validation studies. The same applies for LR negative estimates. The specificity is at best 54% (46% to 62%) for PESI≥III cut-off for 3-month mortality. Shifting the cut-off along the risk scale provides higher values for sensitivity or for specificity (see online supplementary table S6). In figures 2 and 3, sROC plots showing test accuracy of the two most validated models at relevant cut-offs PESI≥III and sPESI≥1 associated with 30-day all-cause death for all studies and for external validation studies are given separately.

sROC plots showing test accuracy of PESI≥III cut-off associated with 30-day all-cause death: all studies (A) and external validation studies (B). HSROC, hierarchical summary receiver operating characteristic; PESI, Pulmonary Embolism Severity Index; sROC, summary receiver operating characteristic.

sROC plots showing test accuracy of sPESI≥1 cut-off associated with 30-day all-cause death: all studies (A) and external validation studies (B). HSROC, hierarchical summary receiver operating characteristic; PESI, Pulmonary Embolism Severity Index; sROC, summary receiver operating characteristic.
Model updating
For better identification of lower and higher risk groups, some studies assessed the effect on outcomes of adding one or more prognostic variables to an existing model. There is increasing evidence about the greater effectiveness of these ‘new models’, even though the existing ones such as PESI, sPESI and PREP are already highly effective.
In the study of Moores, the addition of non-elevated cTnI to low-risk PESI did not improve the negative predictive value compared with either test alone.96 In the Lankeit study,94 the combination of a negative high-sensitive cTnT (hscTnT<14 pg/mL) and a sPESI value of 0 at baseline improved risk classification and reduced the risk of mortality. The same applies for the combination of NT-proBNP (<600 pg/mL) and low-risk sPESI.95 In the study of Ozsu, hscTnT combined with sPESI provided better predictive information than cTnT.101 Adding cTn to the PESI113 and the sPESI115 models resulted in a higher area under the curve (AUC) value with no additive value for Ddimer to PESI and cTn.113 To sum up, there is an increased value in identifying lower risk patients by adding NT-proBNP and hscTnT to PESI or sPESI.
Other update studies tried to improve the identification of high-risk patients. Adding BNP and TTE-RVD to the PREP clinical model resulted in a significant difference in AUC.110 A significant increase in ‘NRI: Net Reclassification Improvement’, as defined by Pencina et al,142 was obtained in the original study which updated PREP model by adding BNP and TTE-RVD to the clinical model.110 Using the PREP cohort in patients with normotensive PE, Sanchez et al showed that biomarkers (cTnI, BNP) and echocardiography provided additional prognostic information to PESI.111 In the Palmieri study104 which included highly selected ‘non-massive central PE’, increased cTnI contributed to identifying patients with increased risk of development of haemodynamic instability, which was independent of, and in addition, to PESI. Novel models80 ,87 ,92 ,135 specifically developed for patients with normotensive PE and integrating biomarkers (cTn, NT-proBNP, heart-type fatty acid-binding protein (H-FABP)), CT or TTE-RVD and US-detected DVT with clinical variables (SBP, HR) or with sPESI, showed a high ability to identify patients at lower risk as well as at higher risk of early death or adverse outcome at the expense of a lower proportion of patients in these risk groups (tables 3 and 4).
Tests of heterogeneity, investigation for publication bias, subgroup analysis and sensitivity analysis
Results of tests for heterogeneity using Cochran's Q test and Higghins I2 statistic, and results of subgroup analyses show major problems of heterogeneity. Comparing results between studies reporting on 30-day all-cause death for PESI optimal cut-offs (PESI≥III, sPESI≥1), all conditions for comparison being optimal (all studies are retrospective and external validation studies, and include ‘both stable and unstable’ patients with PE), we found important between-study heterogeneity (for instance for PESI: Q value=39.69, df 5, p=0.000, I2=87) that might be related to only patient selection in studies. A high proportion of patients at low risk in study population (or a lower proportion of patients at high risk) results in less event rates in the population sample and less event rates within risk groups as shown on forest plots (see online supplementary figures S7–S12). Heterogeneity (I2>50%) was observed in most of the analyses for 30-day all-cause death with PESI≥III and sPESI. At best I2 test for heterogeneity was 39% (all studies combined) and 50% (external validation studies only) in low-risk PESI group.
Findings from the investigation for publication bias using the ‘Funnel Plot’ of SE and precision (=1/SE) by Logit event rate (with comparison of plots with observed studies against plots with observed and imputed studies), and the Egger's test of regression intercept show no evidence of publication bias except for studies using PESI≥III and PESI=V cut-offs for 30-day all-cause death (see online supplementary figures S13.1 and S13.2).
Model impact
The clinical utility of a model is assessed by its effect on clinical decision-making and subsequent patient outcomes. However, few such studies have been performed of the PE models (see online supplementary table S2.4).
The safety of treating patients with low-risk PE as outpatients was examined in two management studies66 ,128 and in two randomised trials.71 ,100 The first management study128 was a feasibility study among low-risk patients based on the GPS model in a very small number of patients. It showed the use of the GPS model to be safe. In the other one-arm management study, patients with stable PE with NT-proBNP<500 pg/mL were treated at home. Seven (4.6%) patients were readmitted within the first 10 days, but there were no deaths, no VTE events and no clinically relevant or major bleeding at 3-month follow-up. The first of the two randomised trials100 did not demonstrate the clinical utility of Uresandi's model118 for outpatient management. The rate of short-term mortality was unexpectedly high in both management groups, as was the rate of VTE events and major bleeding. The second randomised trial71 was a non-inferiority study in highly selected patients with low-risk PE. It showed that outpatient care based on the PESI model can safely and effectively be used in place of inpatient care: 1 (0.6%) death in each group, with 1 (0.6%) VTE and 2 (1.2%) major bleeding events in the outpatient group at a 3-month follow-up. Owing to other eligibility criteria for outpatient management and study design, only 56% (152/271) with low NT-proBNP level,66 13% (132/1016) with low-risk Uresandi's model,100 18% (43/244) with low-risk GPS128 and 44% (344/783) with PESI I-II71 could be treated as outpatients.
The PEITHO study132 randomised patients with normotensive PE at ‘intermediate–high’ risk (with RVD and myocardial injury) to receive tenecteplase (fibrinolytics) or placebo. Death or hemodynamic decompensation occurred in 13/506 patients (2.6%) in the tenecteplase group as compared with 28/499 (5.6%) in the placebo group. Fibrinolytic therapy did not prevent in-hospital death and increased the risk of major haemorrhage and stroke. Models are less specific for predicting poor outcome in normotensive high-risk patients and might benefit from combining prognostic variables for better selection of patients, in particular those at risk of death from PE, as long as patients who are likely to respond to therapy are identified.
Finally, risk stratification was found to be frequently performed in patients admitted with acute PE and found to be stable during a 5-year period.133 Its use was associated with assignment to higher levels of care and more intense treatment, but did not improve the outcome.133
Discussion
Summary of main results
This systematic review identified 17 prognostic models in acute PE and other types of models that were not originally specific to PE or exclusively to its prognosis. Eight models were validated or updated and three were assessed in impact studies. Overall, PESI and sPESI are the models that have been most widely validated and updated, and PESI is the only one that has been assessed and found useful in a randomised trial for treating patients with low-risk PE as outpatients (level 1 of hierarchy of evidence according to McGinn et al143). As expected, the event rates for different outcomes and time points increase along the risk scale in PESI model. The attempt to simplify PESI is attractive and successful in validation studies, but needs to be evaluated in impact studies. Agreement between the simplified PESI and the original PESI is fair.106 PESI and sPESI models are now included in the risk stratification of patients with PE in the 2014 ESC guidelines.3 This new strategy needs to be validated and compared to the existing models. Other prognostic models have shown improvement in identifying low-risk and high-risk groups either on their own (algorithm for the low risk—Shock Index, 2008 ESC high, PREP—Clin III, PESI≥IV, PESI V, eStiMaTe high, FAST 3, Bova stage III for the high risk), or by the addition of one or more clinical, biological and imaging-based markers of RVD and myocardial injury to the existing models or by incorporating these markers into new models (NT-proBNP and hscTn for the low risk—SBP, BNP, cTN, H-FABP, venous US and imaging-based RVD for the high risk). Large validation and impact studies are needed to assess these new and updated models.
Overall completeness and applicability of evidence
Most of the models are effective and provide a low event rate in low-risk groups, and appear reproducible and robust. However, using the model for identifying the low-risk groups may not be worthwhile if the aim is to make a choice to send the patients home; because the patients might still have an unacceptable high risk of a serious adverse outcome. It is important to define the incidence limit for a specific outcome, which should be clinically relevant and if models go beyond this they should not be viewed as of high performance. In agreement with the review of Vinson et al,144 careful selection is needed for low-risk patients with acute PE who will be managed as outpatients. Broad implementation of this management strategy is controversial and varies across countries and across organisation of patient care and patient pathways. Furthermore, decisions about management might be modified by the availability of new oral anticoagulants being studied in large-scale clinical trials.144 Hospital checklist criteria79 ,125 should also be helpful for patient selection and seem to be competitive with prognostic models.
Differences in predictive performance of the models may be due to differences in prognostic criteria and threshold for risk groups regardless of study design, development phase, population, outcome and time point. In two model construction studies68 ,69 using the same cohort and the same outcome, a change in criteria and threshold resulted in change of risk group proportions and event rates within these risk groups. Shifting the cut-off to reduce the incidence of events in the low-risk group led to a smaller proportion of patients in the low-risk group, and selecting patients with lower risk PE makes the model more effective but less efficient. This also applies to the high-risk patient groups: the greater the proportion of patients classified as high risk, the lower the incidence of outcomes in this group and vice versa. Adding biomarker data may help to identify higher or lower risk patients, but the findings on the additive value of biomarkers are inconsistent across studies. This may be explained by the higher predictive performance of some models, heterogeneity in the populations arising from study design66 ,71 ,100 or a higher sensitivity of some biomarkers.94
Quality of the evidence
In our review, we used a comprehensive search strategy, assessed the quality of the included studies to allow us to focus on those of good quality, and used statistical techniques to analyse their results and combine and compare the findings. However, the included studies contain some methodological flaws in the design, conduct and reporting. Many are retrospective or use prospectively collected data for diagnosis purposes, and one of the most common limitations is the lack of reporting of the case-ascertainment strategy used in the study. These problems might lead to selection bias that could have affected the event rates and influence the variables included in the final model. The time of inception of the cohorts (ie, whether it was at diagnosis or on admission) was ill defined and patient selection may have been different across studies. Other common methodological issues are the lack of a justification for the sample size, the absence of a full definition of prognostic variables and the lack of standardisation of treatments which might have been dictated by the prognostic variables that were assessed (and, therefore, may have affected the likelihood of certain outcomes), the lack of blinded assessment of the outcomes (to the prognostic variables), and possible problems with data analysis related to the statistical methods for missing data.
Potential biases in the review process
Our search was performed up to July 2014. Publications after that date were not included in the review. We believe there are no biases in our searches within the search period and decisions on study eligibility. Although we used a highly sensitive search to minimise the influence of reporting biases related to duplicate and cumulative full publication, time lag, language, location and reference list citation,17 it is not possible to know how a study's findings might influence the researchers' decision to publish it; unlike in randomised trials where positive results for new treatments are more likely to lead to full publication. To assess publication bias for proportion and event rates, we applied statistical tests to detect funnel plot asymmetry, but we found little evidence of publication bias. According to Macaskill et al,145 ‘applying such tests in systematic review of diagnostic test accuracy is likely to result in publication bias being incorrectly indicated by the test far too often’.
Data extraction was performed by two reviewers. The second reviewer was not blinded to the data extracted. To ensure quality, data were rechecked by the first reviewer. We assessed study quality using a domain approach17 rather than a scale. This is more transparent to the reader, by showing how each study is performed in each aspect of conduct. As shown by Juni et al,19 ‘the use of summary scores to identify trials of high quality is problematic and relevant methodological aspects should be assessed individually and their influence on effect sizes explored’.
Our analyses were performed for distinct models, outcomes/time points, with subgroup and sensitivity analyses to deal with heterogeneity. We used multiple statistical techniques, which could introduce bias in the selection of results to present, but no discrepancies were found across the results and all analyses are available. We used absolute risk rather than relative risk because this is more appropriate for estimating the risks for individual patients.
Comparison with other reviews
This study was not limited to only clinical prediction rules and to our knowledge, it is the first broad systematic review and meta-analysis of prognostic models in patients with acute PE. There are two published systematic reviews on clinical prediction rules146 ,147 and a meta-analysis of PESI models,148 but, as discussed below, our systematic review has important differences to all of these, expands their scope considerably and provides more comprehensive and up-to-date data (table 6).
Comparison of our study with existing systematic reviews and meta-analyses of clinical prediction rules
We believe the key strengths of our review are well-defined selection criteria, broad search strategy, and presentation of results of all available predictive models with full details on study characteristics, population and prognostic information and study quality. We used a domain approach and prognostic criteria for the assessment of study quality. Quantitative analyses are provided to answer each aspect of model development in accordance with the recommendations of recently published guidelines for prognostic model research,149 for different outcomes and time points in ‘both stable and unstable’ as well as in ‘stable’ PE, and at various cut-offs, with the aim of improving management of patients with acute PE who are either at low risk or at high risk. For the analysis of performance, we provide a summary estimate of sensitivity and specificity and also a summary estimate of event rates (‘absolute risk’149) within risk groups, which is more meaningful for clinicians and seems more appropriate for the study of prognosis.
Conclusions
Our systematic review provides useful information on the prediction ability and the utility of existing prognostic models in acute PE that might help clinicians and researchers for the identification of patients at low risk of events for safe early discharge or outpatient management and those at high risk who may need closer monitoring or more aggressive therapy. It shows the potential for improving the selection of lower risk and higher risk groups in patients with normotensive PE with novel and updated models that integrate biomarkers (cTn, BNP, NT-proBNP, H-FABP), CT or TTE-RVD and US-detected DVT into existing models or with other clinical variables (systolic blood pressure, heart rate). These findings provide a good direction for future research in validation and impact studies.
Acknowledgments
The authors wish to thank Nicola PEARCE-SMITH at the Department of Knowledge and Information Science, Oxford, UK, and Anne BRICE at James Lind Initiative, Oxford, UK for their helpful advice on search strategy.
References
Footnotes
Contributors AE and MC conceived the study. AE, SM, and MC designed the study. AE, MD-E and J-NP undertook the literature search and extracted data. AE did data analysis. AE, SM and MC interpreted data. AE developed the first draft. AE and MC contributed to the writing of the manuscript. All authors provided critical comments and approved the final version. AE had full access to all the data in the study and had final responsibility for the decision to submit for publication. All researchers had access to all the data. AE as guarantor accepts full responsibility for the work and the conduct of the study. AE affirms that the manuscript is an honest, accurate, and transparent account of the study being reported; that no important aspects of the study have been omitted; and that any discrepancies from the study as planned have been explained.
Funding This research received no specific grant from any funding agency in the public, commercial or not-for-profit sectors.
Competing interests None declared.
Provenance and peer review Not commissioned; externally peer reviewed.
Data sharing statement No additional data are available.