
Abstract
Objective. Wearable electrical impedance tomography (EIT) can be used to monitor regional lung ventilation and perfusion at the bedside. Due to its special system architecture, the amplitude of the injected current is usually limited compared to stationary EIT system. This study aims to evaluate the performance of current injection patterns with various low-amplitude currents in healthy volunteers. Approach. A total of 96 test sets of EIT measurement was recorded in 12 healthy subjects by employing adjacent and opposite current injection patterns with four amplitudes of small current (i.e. 1 mA, 500 uA, 250 uA and 125 uA). The performance of the two injection patterns with various currents was evaluated in terms of signal-to-noise ratio (SNR) of thorax impedance, EIT image metrics and EIT-based clinical parameters. Main results. Compared with adjacent injection, opposite injection had higher SNR (p < 0.01), less inverse artifacts (p < 0.01), and less boundary artifacts (p < 0.01) with the same current amplitude. In addition, opposite injection exhibited more stable EIT-based clinical parameters (p < 0.01) across the current range. For adjacent injection, significant differences were found for three EIT image metrics (p < 0.05) and four EIT-based clinical parameters (p < 0.01) between the group of 125 uA and the other groups. Significance. For better performance of wearable pulmonary EIT, currents greater than 250 uA should be used in opposite injection, 500 uA in adjacent one, to ensure a high level of SNR, a high quality of reconstructed image as well as a high reliability of clinical parameters.
Export citation and abstract BibTeX RIS

Original content from this work may be used under the terms of the Creative Commons Attribution 4.0 licence. Any further distribution of this work must maintain attribution to the author(s) and the title of the work, journal citation and DOI.
1. Introduction
Electrical impedance tomography is an emerging medical imaging technique capable of producing tomographic images of electric properties of human body (He et al 2023). Since human organs differ in terms of electric properties and the same tissue may also manifest different electrical properties with varying physio-pathological states , EIT has great potential in clinical practice, including disease diagnosis, treatment guidance and function evaluation (Rezanejad Gatabi et al 2022, Rubin and Berra 2022). Compared with other imaging techniques, such as CT and MRI, EIT has the actual suits of high temporal resolution (up to 100 frames per second), non-radiation and non-invasiveness, while it is also characterized by low cost and desirable portability (Liu et al 2020, Adler and Holder 2021, Liu et al 2021). These unique advantages make EIT a powerful modality for bedside visualization of temporal changes of regional pulmonary ventilation. So far, it has been widely used to develop lung protective ventilation strategies in the intensive care units and operating rooms (Taenaka et al 2023, Tuffet et al 2023). Recently, the possibility to design wearable EIT systems further facilitate the use of EIT in clinical settings and introduces new scenarios for its practical applications, such as prolonged monitoring of ventilation of patients with contagious diseases (e.g. COVID-19) in the isolation ward of ICU, as well as remote monitoring in non-hospital environments (e.g. patients' homes) (Yang et al 2021b, Pennati et al 2023). At present, the wearable EIT system seems a promising frontier of EIT technique.
In pulmonary EIT, a set of electrodes (typically 8, 16 or 32 electrodes) are placed around the thorax at the 4–5th intercostal space. A harmless sinusoidal current is injected into the human thorax through a pair of electrodes (also known as excitation electrodes), for which their relative positions can be arbitrarily specified. At the same time, the resulting surface potentials on the rest of the electrode pairs (also known as measurement electrodes) are simultaneously measured. Next, current injection rotates in the electrode array until each pair of electrodes serve as excitation electrodes for once, and finally all of the measured potentials form one frame of EIT data. The difference of two frames of EIT data at two instants are then reconstructed as an EIT image, which reflects the impedance change of thoracic interior (Borgmann et al 2022, Liu et al 2023). As a tomographic imaging technique, the quality of image reconstruction is critical for practical ventilation monitoring (Hahn et al 2008, Ma et al 2020). However, due to the nonlinear nature of current distribution within the imaging domain, EIT exhibits severe ill-posedness in that surface potential is very sensitive to the peripheral impedance change near the electrode, whereas the central region of the imaging domain has a much lower sensitivity (Liu et al 2015, Hamilton et al 2017). Therefore, it is imperative to maximize the sensitivity of EIT to improve the practicality of pulmonary EIT.
A number of research groups have proposed various approaches to resolve this issue, including the number of electrodes, current injection patterns and the current amplitude. Theoretically, increasing the number of electrodes might be an effective method because more resulting surface potentials could be collected for image reconstruction. However, this not only leads to greater complexity of EIT data acquisition system, but also lengthens the time for data acquisition and image reconstruction (Tawil et al 2011, Czaplik et al 2014, Stowe and Adler 2020, Zhao et al 2022). Another option is to optimize current injection. The current injection patterns determine the path through which current passes the human body. Consequently, current injection strategies have definite impact on the sensitivity of the measured potentials to impedance changes within the body, which is noted as EIT sensitivity. Also, current injection patterns can be optimized without additional cost on hardware system or operational burden in practical applications (Tang et al 2010, Adam and Ammayappan 2021). Thus, it is of great importance to explore an optimal current injection pattern for pulmonary EIT to maximize its sensitivity. For a stationary EIT system, a relatively large current is offered to increase the signal-to-noise (SNR) in EIT measurements. But wearable/portable EIT systems are more acceptable in clinical practice. Unfortunately, in a wearable EIT system a low power consumption is required because the system is usually powered by portable energy sources (e.g. batteries), which can only afford a small current for excitation (Hong et al 2015, Huang and Loh 2015, Huang et al 2016, Minseo et al 2017). Consequently, it is imperative to investigate the performance of current injection patterns in the context of small currents, to set up a reference for wearable pulmonary EIT development.
Several groups have studied the influence of current injection on EIT reconstruction (e.g. Seagar et al 1987, Xu et al 2008, Zhang et al 2010, Adler et al 2011, Bera and Nagaraju 2012, Luppi Silva et al 2017, Russo et al 2017, Tarabi et al 2022). Most of the previous studies employed simulation or phantoms with homogeneous impedance distribution, which is far different from the actual human chest with highly inhomogeneous impedance distribution. Besides, small amplitudes of injection current were not considered and the results from practical applications were not evaluated either. This study aims to evaluate the performance of current injection patterns with various low-amplitude currents in healthy volunteers.
2. Materials and methods
In this study, we first measured chest EIT data from healthy subjects by employing the adjacent and opposite current injection patterns respectively. Four small amplitudes of injection current (1 mA, 500 uA, 250 uA and 125 uA) were explored in the study. Subsequently, SNR of thorax impedance, EIT image quality and EIT-based clinical parameters of the current injection patterns with various amplitudes were evaluated systematically.
2.1. Ethical statement and subjects
This study protocol was approved by the Ethics Committees of the Fourth Military Medical University, Xi'an, Shaanxi, People's Republic of China (KY20224101-1). This study was conducted in accordance with the principles embodied in the Declaration of Helsinki and in accordance with local statutory requirements.
All subjects were informed with the study protocol and signed written consent forms before participating in the study. Twelve healthy male subjects (age, 27.6 ± 2.5 years; weight, 72.9 ± 10.1 kg; height,178.7 ± 3.4 cm) were included and all of them underwent a thorough medical screening, which included smoking history and clinical examinations focusing on the respiratory system. Also, all volunteers performed pulmonary function test (slow vital capacity and forced vital capacity maneuvers) to exclude restrictive and obstructive lung diseases with a portable spirometer (ChestGraph HI-101, Chest M.I., Inc., Tokyo, Japan).
2.2. EIT application protocol
2.2.1. EIT electrodes placement
In order to ensure a desirable and stable contact between electrodes and skin during EIT data acquisition, disposable and self-adhesive Ag/AgCl electrodes (3M, USA) were used and equally attached around the thorax at the level of the 4–5th intercostal space. The procedures of EIT electrode placement for each subject were as follows. First, the chest circumference of each subject, denoted as M, was measured to calculate the distance L between two adjacent electrodes by L = M/16. Next, Electrode #1 and #16 were equally placed on the two sides of the sternum with a distance of L/2, and Electrode #8 and #9 on the two sides of the spine to avoid the bony parts (sternum and spine) with high impedance hindering the excitation current into the thorax. Third, the remaining electrodes were equidistantly attached in sequence. Finally, an elastic belt comprising 16 electrode buckles (MidasMED Biomedical technology, Suzhou, China) was connected to all the electrodes to improve electrode stability (figure 1(a)) prior to connection to the EIT data acquisition system through an electrode wire.
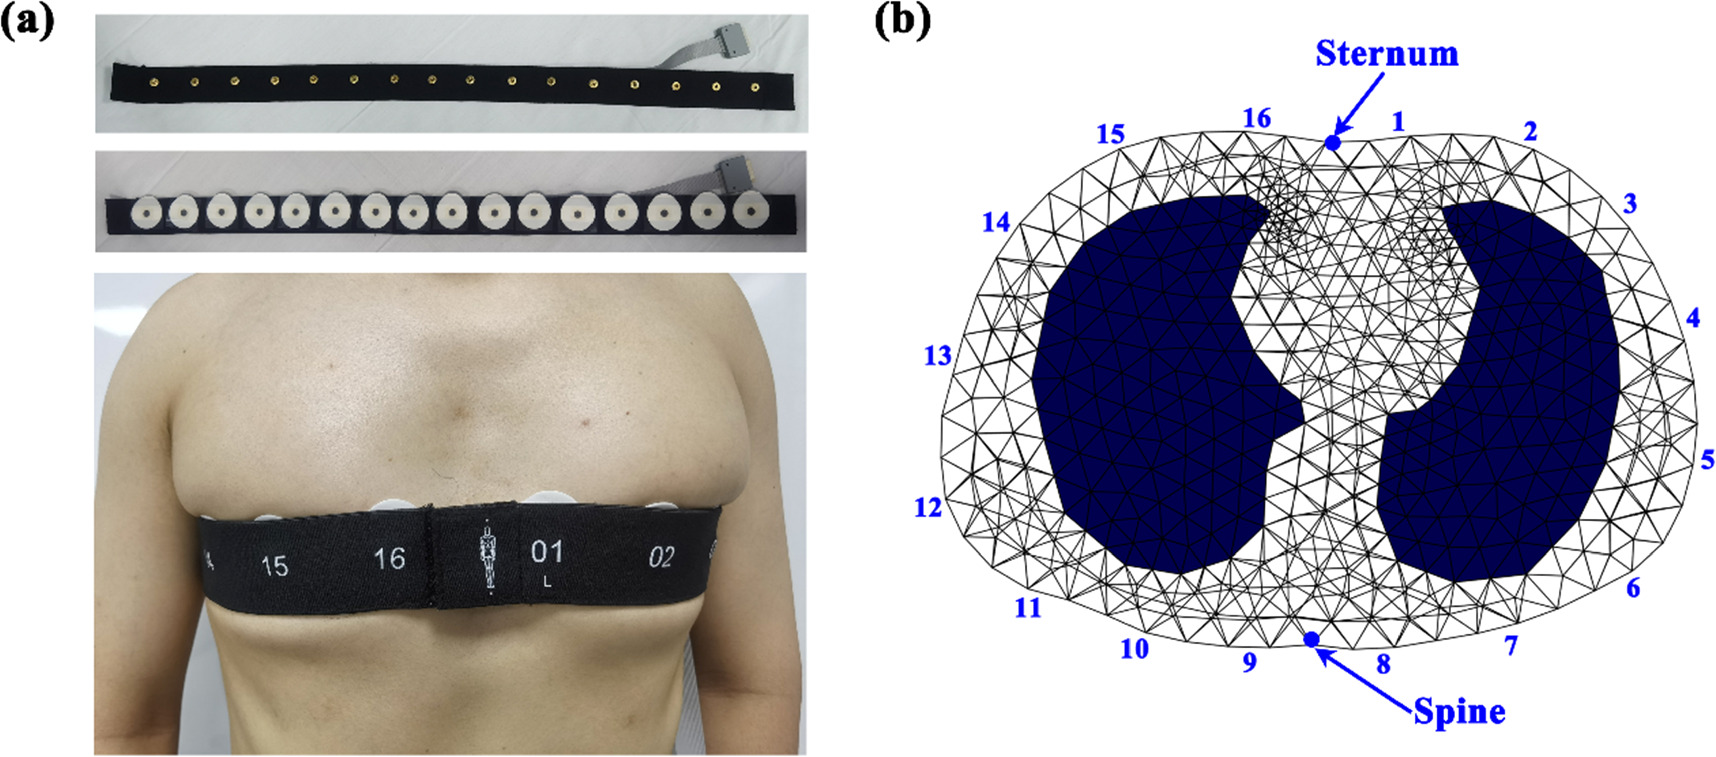
Figure 1. EIT electrode application: (a) EIT electrode belt; (b) EIT electrodes positioning in the chest model for image reconstruction.
Download figure:
Standard image High-resolution image2.2.2. EIT data measurement
A wireless and wearable EIT system (MidasMED Biomedical technology, Suzhou, China) for pulmonary ventilation was used to carried out EIT data measurement (Yang et al 2023). This system can work at 50 kHz with an acquisition rate of 20 frame per second and a wide current range from 100 uA to 1 mA. The measurement stability can be up to 0.1% relative change for a long-term measurement of 3 h and its measurement SNR is greater than 70 dB, as tested with a resistor phantom. The wearable system occupies a total volume of 10 × 8 × 3 cm3 and can wirelessly transmit data to the host computer through Bluetooth. The whole system is powered by a small lithium battery (+3.7 V).
Throughout the whole data acquisition period, the participants were asked to maintain a sitting position with calm breathing. The opposite current injection pattern was selected by the host computer and four amplitudes of current (1 mA, 500 uA, 250 uA and 125 uA) were configured sequentially. For each current injection, EIT data was recorded for ∼2 min. Subsequently, the adjacent current injection pattern was chosen and the identical current amplitudes and sequence were conducted.
2.2.3. EIT image reconstruction
The time-series EIT images were reconstructed with the GREIT (Graz consensus Reconstruction algorithm for EIT) algorithm, which was specially designed for lung imaging (Adler et al
2009). To improve the accuracy of EIT images, a realistic thorax model was established to produce the reconstruction matrix. First, the contours of thorax and lungs were extracted from an CT image of an adult in the EIDORS toolbox (https://eidors3d.sourceforge.net/). After setting the positions of the 16 electrodes corresponding to the realistic locations, a 2.5D FEM (finite element method) model consisting of 24 505 triangular elements was produced by an automatic mesh generator NETGEN 5.3, as shown in figure 1(b). Then, to avoid reconstruction bias introduced by conductivity change in the lung regions, we determined to set a homogeneous conductivity distribution within the thorax to perform EIT images reconstruction for all subjects, which have been adopted by the commercial EIT systems, such as PulmoVista 500 (Teschner et al
2015) and Pulmo EIT-100 (Qu et al
2021). Next, using identical algorithm parameters such as noise figure (NF) of 0.5, the two patterns of current injection were configured to calculate reconstruction matrices ( and
and  for adjacent and opposition injection, respectively). In this study, the reconstructed matrix was resized to the dimension 1024*
 in which 1024 denoted the EIT image size (32 × 32 pixels) and
  denoted the number of one frame of EIT data (192 for opposite injection and 208 for adjacent injection). The purpose of obtaining EIT images with a resolution of 32 × 32 pixels is to facilitate analysis of regional ventilation (Leonhäuser et al
2018, Brabant et al
2022, Larrabee et al
2023).
denoted the number of one frame of EIT data (192 for opposite injection and 208 for adjacent injection). The purpose of obtaining EIT images with a resolution of 32 × 32 pixels is to facilitate analysis of regional ventilation (Leonhäuser et al
2018, Brabant et al
2022, Larrabee et al
2023).
In this study, difference imaging was used to reconstruct the time-series EIT images ventilation over time. For each current injection of each subject, the recorded EIT data at the end of expiration of the first respiratory cycle was designated as the reference  to calculate time-series EIT images
  at all moments with 2 min by using the reconstruction matrix
  (
( or
or  ):
):  where
where  and
and  were the EIT image and the EIT data at the instant
  respectively.
In addition, the time-series thorax impedance  was calculated with
  where
where  was the thorax impedance at the instant
  and
and  was the
  pixel of
For subsequent analysis, functional EIT (fEIT) images were generated by applying the time-series EIT images  to measure the specific regional ventilation characteristics. Because the fEIT-regression method was very robust to signals with different phase information (Zhao et al
2018), it was used to calculate the fEIT image
to measure the specific regional ventilation characteristics. Because the fEIT-regression method was very robust to signals with different phase information (Zhao et al
2018), it was used to calculate the fEIT image  in which each pixel was a regression coefficient of the following linear regression formula:

where  denotes time-dependent relative impedance value of the
  pixel in the time-series EIT images;
  denotes the time-dependent impedance value of the whole thorax;
  and
and  are regression coefficients and
  is the fitting error. As a result,
  will be the value plotted in the
  pixel in the fEIT image
 represents a statically measure which is used to measure the average functional relationship between the global lung impedance and the
  pixel impedance. The positive
  indicates that the
  pixel impedance increases with the global lung impedance while the negative
  indicates that the
  pixel impedance decreases with the global lung impedance. Therefore, the pixels with positive value in the fEIT image could be considered as the ventilation regions while the pixels with negative value represented the reconstruction artifacts.
2.3. EIT data analysis
In this section, we proposed 4 EIT data quality evaluation measures to assess the EIT measurements. Together with 4 clinically accepted EIT-based parameters, we systematically compared the EIT data with opposite and adjacent current injection patterns.
2.3.1. EIT signal evaluation
SNR was chosen as a quality metric of the EIT signal, namely the time-series thorax impedance  in this study. The main reason is that the SNR is directly related to the level of noise present in the EIT signal and the estimate of SNR values can be calculated directly with appropriate methods. To achieve precise calculation of SNR of the EIT signal, we first defined noise as all components except for the respiratory component and then employed the discrete wavelet transform (DWT) to separate the respiratory component from the noise component (Yang et al
2022).
in this study. The main reason is that the SNR is directly related to the level of noise present in the EIT signal and the estimate of SNR values can be calculated directly with appropriate methods. To achieve precise calculation of SNR of the EIT signal, we first defined noise as all components except for the respiratory component and then employed the discrete wavelet transform (DWT) to separate the respiratory component from the noise component (Yang et al
2022).
It was assumed that the thorax impedance ![$s[t]$](https://content.cld.iop.org/journals/0967-3334/45/2/025004/revision2/pmeaad2215ieqn39.gif) is an additive mixture of respiratory component
is an additive mixture of respiratory component ![$r[t]$](https://content.cld.iop.org/journals/0967-3334/45/2/025004/revision2/pmeaad2215ieqn40.gif) and noise component
and noise component ![$n[t],$](https://content.cld.iop.org/journals/0967-3334/45/2/025004/revision2/pmeaad2215ieqn41.gif) leading to the equation
leading to the equation ![$s[t]=r[t]+n[t].$](https://content.cld.iop.org/journals/0967-3334/45/2/025004/revision2/pmeaad2215ieqn42.gif) The DWT method involved a two-stage practice: decomposition and rebuilding. In the first stage, the so-called wavelet functions and scaling functions were used to decompose the thorax impedance
The DWT method involved a two-stage practice: decomposition and rebuilding. In the first stage, the so-called wavelet functions and scaling functions were used to decompose the thorax impedance ![$s[t]$](https://content.cld.iop.org/journals/0967-3334/45/2/025004/revision2/pmeaad2215ieqn43.gif) and thus the low-varying signal
and thus the low-varying signal ![${a}_{i}[t]$](https://content.cld.iop.org/journals/0967-3334/45/2/025004/revision2/pmeaad2215ieqn44.gif) (approximation coefficient) and the fast-varying signal
(approximation coefficient) and the fast-varying signal ![${d}_{i}[t]$](https://content.cld.iop.org/journals/0967-3334/45/2/025004/revision2/pmeaad2215ieqn45.gif) (detail coefficient) could be obtained at each level, where
(detail coefficient) could be obtained at each level, where  denotes the
  level. Theoretically,
 ![${a}_{i}[t]$](https://content.cld.iop.org/journals/0967-3334/45/2/025004/revision2/pmeaad2215ieqn48.gif) included the respiratory component
included the respiratory component ![$r[t],$](https://content.cld.iop.org/journals/0967-3334/45/2/025004/revision2/pmeaad2215ieqn49.gif) because
because ![$r[t]$](https://content.cld.iop.org/journals/0967-3334/45/2/025004/revision2/pmeaad2215ieqn50.gif) could be considered as a low-varying signal and independent
could be considered as a low-varying signal and independent ![$r[t]$](https://content.cld.iop.org/journals/0967-3334/45/2/025004/revision2/pmeaad2215ieqn51.gif) could be obtained at an appropriate level. In this study, we empirically selected db4 as the mother wavelet and set decomposition level to 4 by comparison. Conversely, in the second stage, by transforming the coefficient
could be obtained at an appropriate level. In this study, we empirically selected db4 as the mother wavelet and set decomposition level to 4 by comparison. Conversely, in the second stage, by transforming the coefficient ![${a}_{i}[t]$](https://content.cld.iop.org/journals/0967-3334/45/2/025004/revision2/pmeaad2215ieqn52.gif) (
(![${a}_{4}[t]$](https://content.cld.iop.org/journals/0967-3334/45/2/025004/revision2/pmeaad2215ieqn53.gif) in this study) back to the time domain through inverse wavelet functions, the denoised signal estimation
in this study) back to the time domain through inverse wavelet functions, the denoised signal estimation ![$\tilde{r}[t]$](https://content.cld.iop.org/journals/0967-3334/45/2/025004/revision2/pmeaad2215ieqn54.gif) was obtained. On the other hand, the estimated noise
was obtained. On the other hand, the estimated noise ![$\tilde{n}[t]$](https://content.cld.iop.org/journals/0967-3334/45/2/025004/revision2/pmeaad2215ieqn55.gif) was computed by subtracting the noise-free signal estimate
was computed by subtracting the noise-free signal estimate ![$\tilde{r}[t]$](https://content.cld.iop.org/journals/0967-3334/45/2/025004/revision2/pmeaad2215ieqn56.gif) from the thorax impedance
from the thorax impedance ![$s[t],$](https://content.cld.iop.org/journals/0967-3334/45/2/025004/revision2/pmeaad2215ieqn57.gif) i.e.
i.e. ![$\tilde{n}[t]=s[t]-\tilde{r}[t].$](https://content.cld.iop.org/journals/0967-3334/45/2/025004/revision2/pmeaad2215ieqn58.gif) Finally, the SNR of the EIT signal
Finally, the SNR of the EIT signal ![$SNR[t]$](https://content.cld.iop.org/journals/0967-3334/45/2/025004/revision2/pmeaad2215ieqn59.gif) was calculated in decibels according to the classical format as follows:
was calculated in decibels according to the classical format as follows:

where  denotes the time duration of data acquisition.
2.3.2. EIT image quality evaluation
Three metrics were proposed to evaluate the change of functional EIT image with varying conditions for current injection:
2.3.2.1. Lung separation
This metric is designed to describe the degree of separation of the ventilated regions of both lungs, which was measured by the difference of the peak values in the ventilated regions and the minimum between these two ventilated regions, as shown in figure 2. It was calculated by the following formula:

where  calculated by the mean of the pixel values in line 16 and 17 of the fEIT image
  (32 × 32 pixels), was the impedance distribution contour along the coronal axis;
  was the minimum of
 and
and  were the peak values of
  in the left and right lung, respectively.
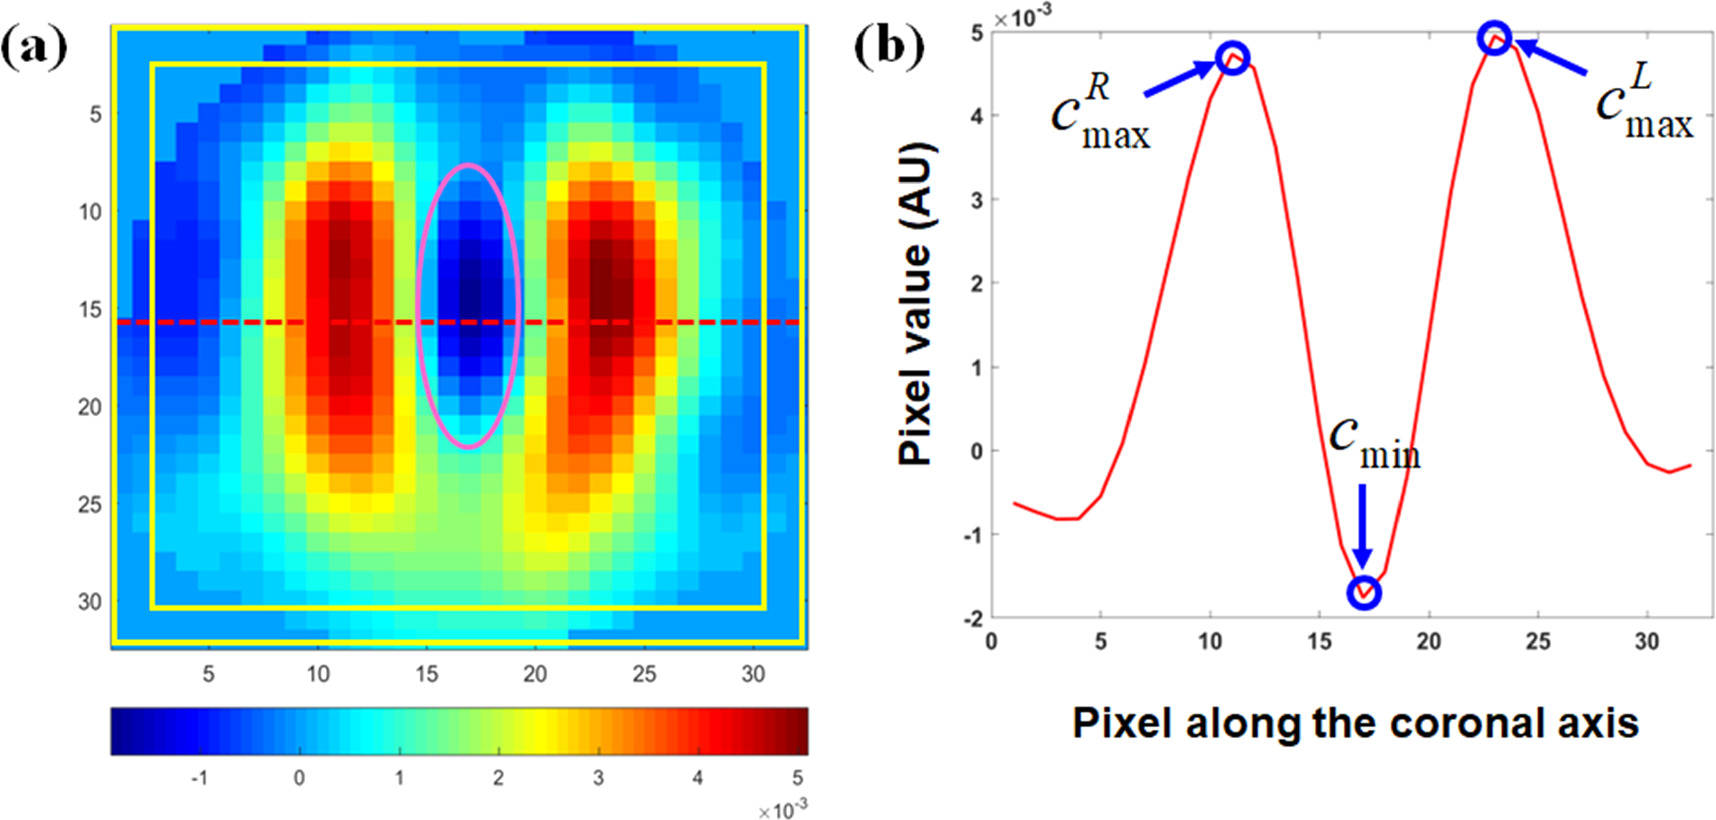
Figure 2. Schematic diagrams of the EIT image evaluation metrics. (a) Functional EIT image: the pixels with positive value in the fEIT image represents the ventilation regions while the pixels with negative value represents the reconstruction artifacts; the red line indicates the location where the impedance distribution contour along the coronal axis was obtained; the area between the two rectangles with yellow outlines is the boundary region, in which the pixels had a distance of less than 2 pixels away from the edge; the ellipse with pink outline indicates the region in which the inverse artifacts were located. (b) The impedance distribution contour  along the coronal axis, in which
  was the minimum of
 and
and  were the peak values of c in the left and right lung, respectively.
Download figure:
Standard image High-resolution imageLarger lung separation represents better lung separation.
2.3.2.2. Inverse artifacts
This metric represents the degree of reconstructed artifacts as well as the noise of the area outside the lungs, which was measured by the ratio of the sum of negative pixel values and the sum of positive pixel values in the fEIT image:

where  was the number of pixels with
 was the number of pixels with

Smaller inverse artifacts represents less inverse artifacts.
2.3.2.3. Boundary artifacts
This metric evaluates the degree of reconstructed artifacts within the boundary region near the electrodes, which was measured by the ratio of sum of pixel values within the boundary area and the total pixel values in the fEIT image:

where  was the number of pixels (less than 2 pixels away from the edge) within boundary area;
  was the number of pixels with
Smaller boundary artifacts represents less boundary artifacts.
2.3.3. EIT-based clinical parameters evaluation
Four EIT-based parameters of common use, including center of ventilation (CoV), dorsal fraction of ventilation (VD), global inhomogeneity (GI) index, and standard deviation of regional ventilation delay index (RVDSD) were employed to evaluate the influence of varying current injections on clinical application (Yang et al 2021a). CoV, VD and GI were calculated from the fEIT image.
CoV depicts the ventilation distribution influenced by gravity or lung diseases, which is calculated by the relative impedance weighted by the pixel's location in the anteroposterior coordinate:

where  is the height of the
  pixel with scaled value so that the bottom of the fEIT image (dorsal side) is 100% and the top (ventral side) is 0%.
VD reflects the ventilation distribution in the dorsal side, which is calculated as the sum of all pixel values in the dorsal side of the fEIT image over the sum of all pixel values of the fEIT image:

GI indicates the heterogeneity of lung ventilation, which is calculated as the degree of deviation of all pixel values from the median values in the fEIT image:

where  denotes the pixel in the identified lung area,
  represents all the pixels in the lung area, and pixel
  is considered to belong to a lung region if
  A high GI index indicates large variation among pixel values; therefore, this parameter is used as an indicator of heterogeneity.
RVDSD represents the distribution of regional ventilation delay (RVD) which is calculated as the time percentage of pixel impedance increase in the global impedance curve:

where  denotes the time needed for pixel
  to reach 40% of its maximum inspiratory impedance; pixel
  belongs to the lung ventilation regions if
  and
and  represents the tidal breathing variation,
  in which
  and
and  denotes the raw EIT images at the end-inspiration and end-expiration, respectively;
  represents the inspiration time calculated from the global impedance curve. For the time-series EIT images of each current injection of each subject, RVD of each pixel within the lung ventilation regions at each respiratory cycle was first calculated and then the mean value of RVD of each pixel over all respiratory cycle was computed, as denoted by
  Further, RVDSD was calculated as the standard deviation of RVD of all pixels within the lung area:
In addition, the relative change of each parameter was also calculated as follows:  where
where  represents the reference/baseline and was defined as the value at 1 mA,
  denotes an EIT-based parameter, and
  indicates the current with a specified amplitude, including 1 mA, 500 uA or 250 uA.
2.4. Statistical analysis
In order to evaluate the influence of current injection on SNR of EIT measurement, the SNR values calculated for opposite and adjacent current injection with four amplitudes of current (1 mA, 500 uA, 250 uA and 125 uA) were respectively compared with the paired-samples t-test at each current. Significance levels were corrected for multiple comparisons using Holm's sequential Bonferroni method. To analyze the characteristics of SNR change over current amplitude, the SNR variation between the two current injection patterns were compared with a repeated-measures analysis.
In the assessment of the effect of current injection on EIT image quality, three metrics of EIT image with four amplitudes of current were compared for each current injection pattern. Similarly, EIT-based clinical parameters were compared as well. The statistical comparisons were carried out with the post hoc test after a one-way analysis of variance (ANOVA).
In this study, SPSS 22 (IBM Software, Armonk, NY, USA) was utilized to perform statistical analysis, and a p-value < 0.05 was considered statistically significant.
3. Results
All subjects were able to maintain stable sitting posture and relax tidal breathing. A total of 96 sets of chest EIT data were obtained.
3.1. Comparison of SNR between opposite and adjacent current injection with different amplitudes of current
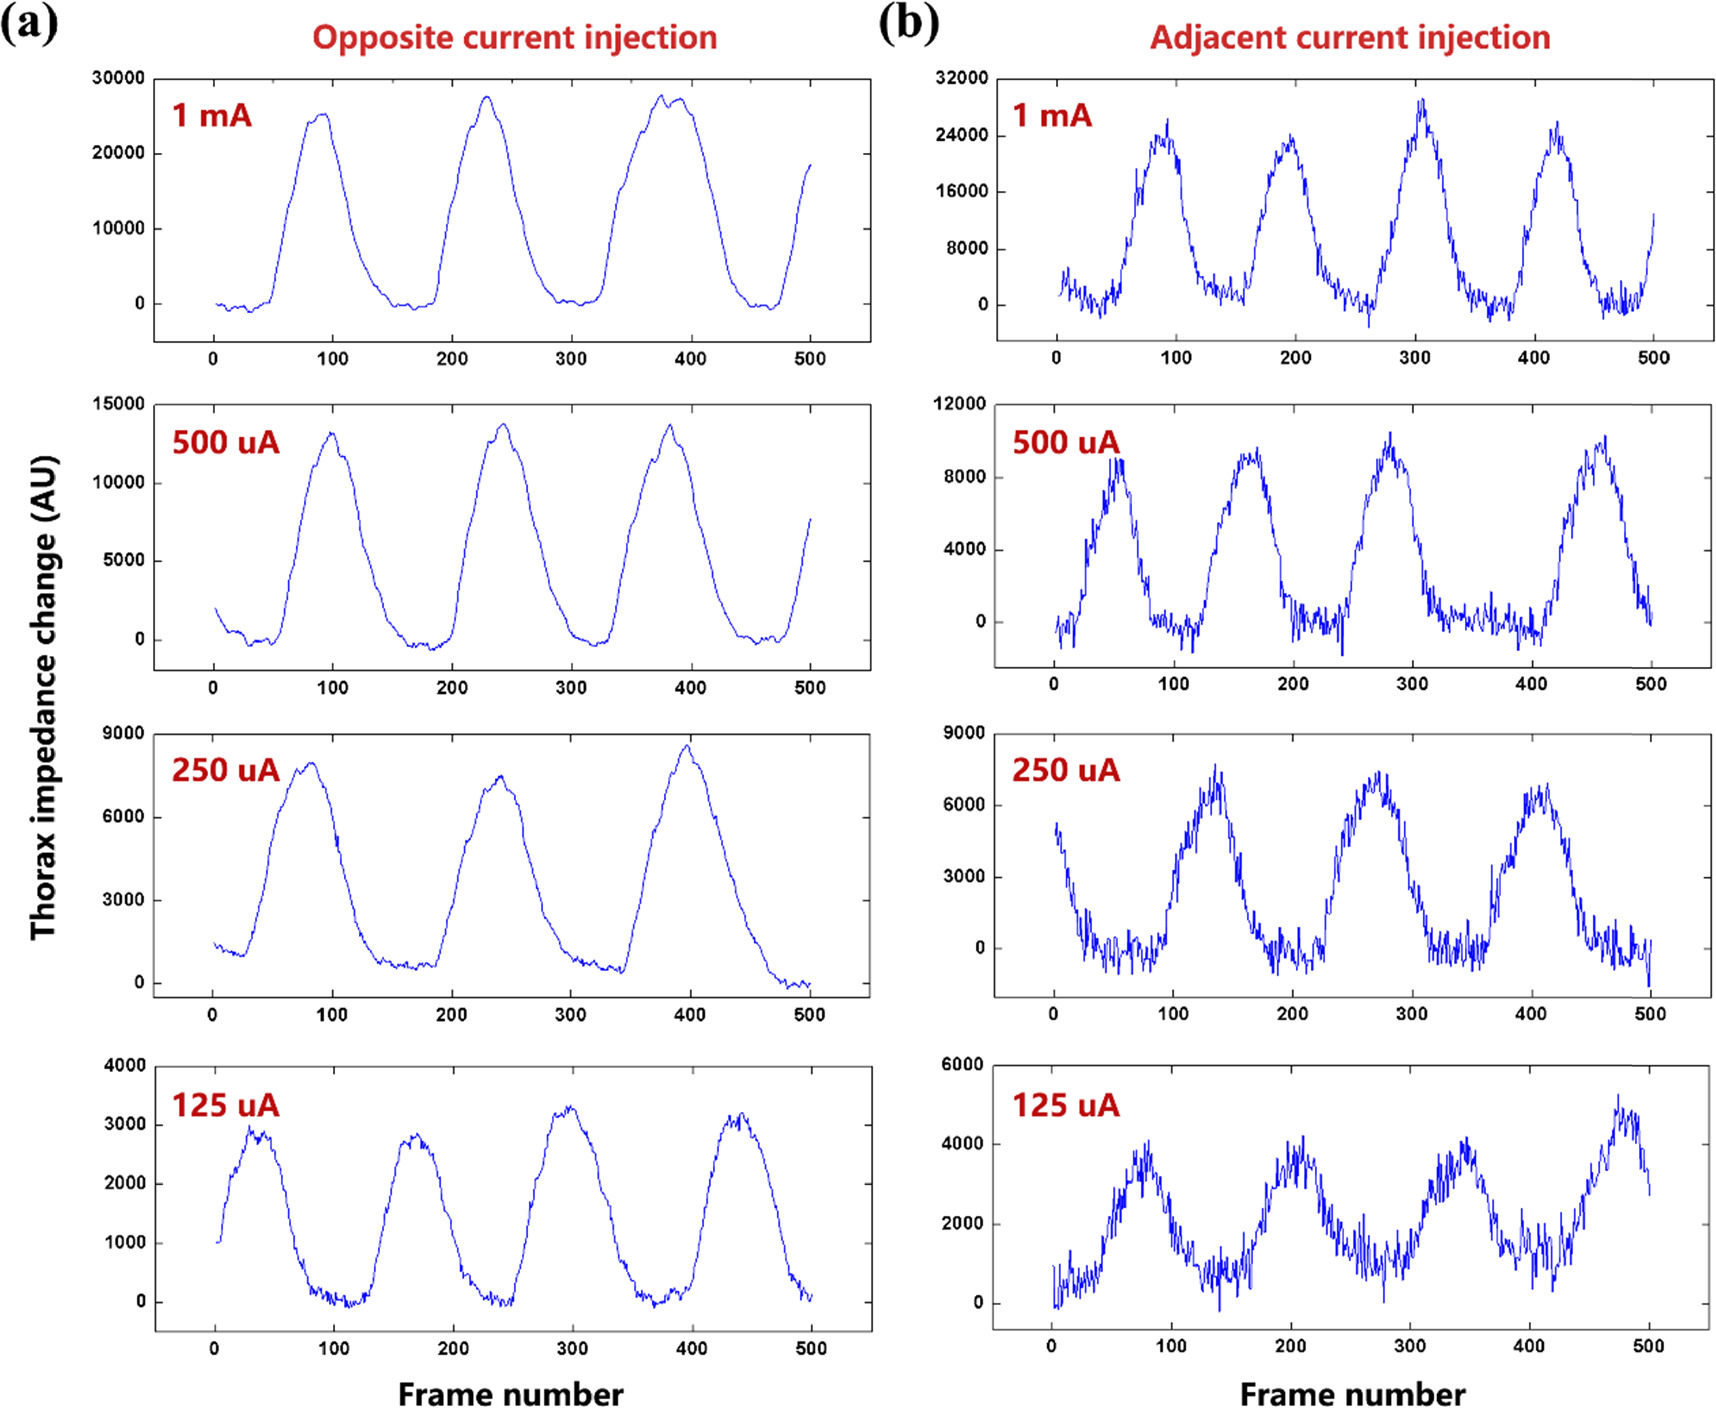
Figure 3 shows the thorax impedance change of Subject #1 with opposite and adjacent current injection with four amplitudes of current (1 mA, 500 uA, 250 uA and 125 uA). As the current amplitude decreased, the thorax impedance decreased by multiple but the noise increased for both current injection patterns. The noise level of adjacent current injection was higher than that of opposite current injection with the same current amplitude.

Figure 3. The thorax impedance change of Subject #1 with opposite and adjacent current injection with four amplitudes of current (1 mA, 500 uA, 250 uA and 125 uA): (a) opposite current injection, and (b) adjacent current injection. For clear demonstration of detailed features of the thorax impedance curve, only 500 frames of data are presented.
Download figure:
Standard image High-resolution imageFigure 4 shows the separation of the respiratory component and noise component in the thorax impedance of Subject #1. By adopting DWT, both the noise and respiratory impedance were estimated (figure 4(a)). The noise belonged to broadband interferences exhibiting a roughly uniform distribution of power within the sampling frequency band while the respiratory component was a narrowband signal presenting only one obvious peak of power (figure 4(b)). This illustrates the effectiveness of DWT in the separation of the respiratory signal and noise component from thorax impedance.
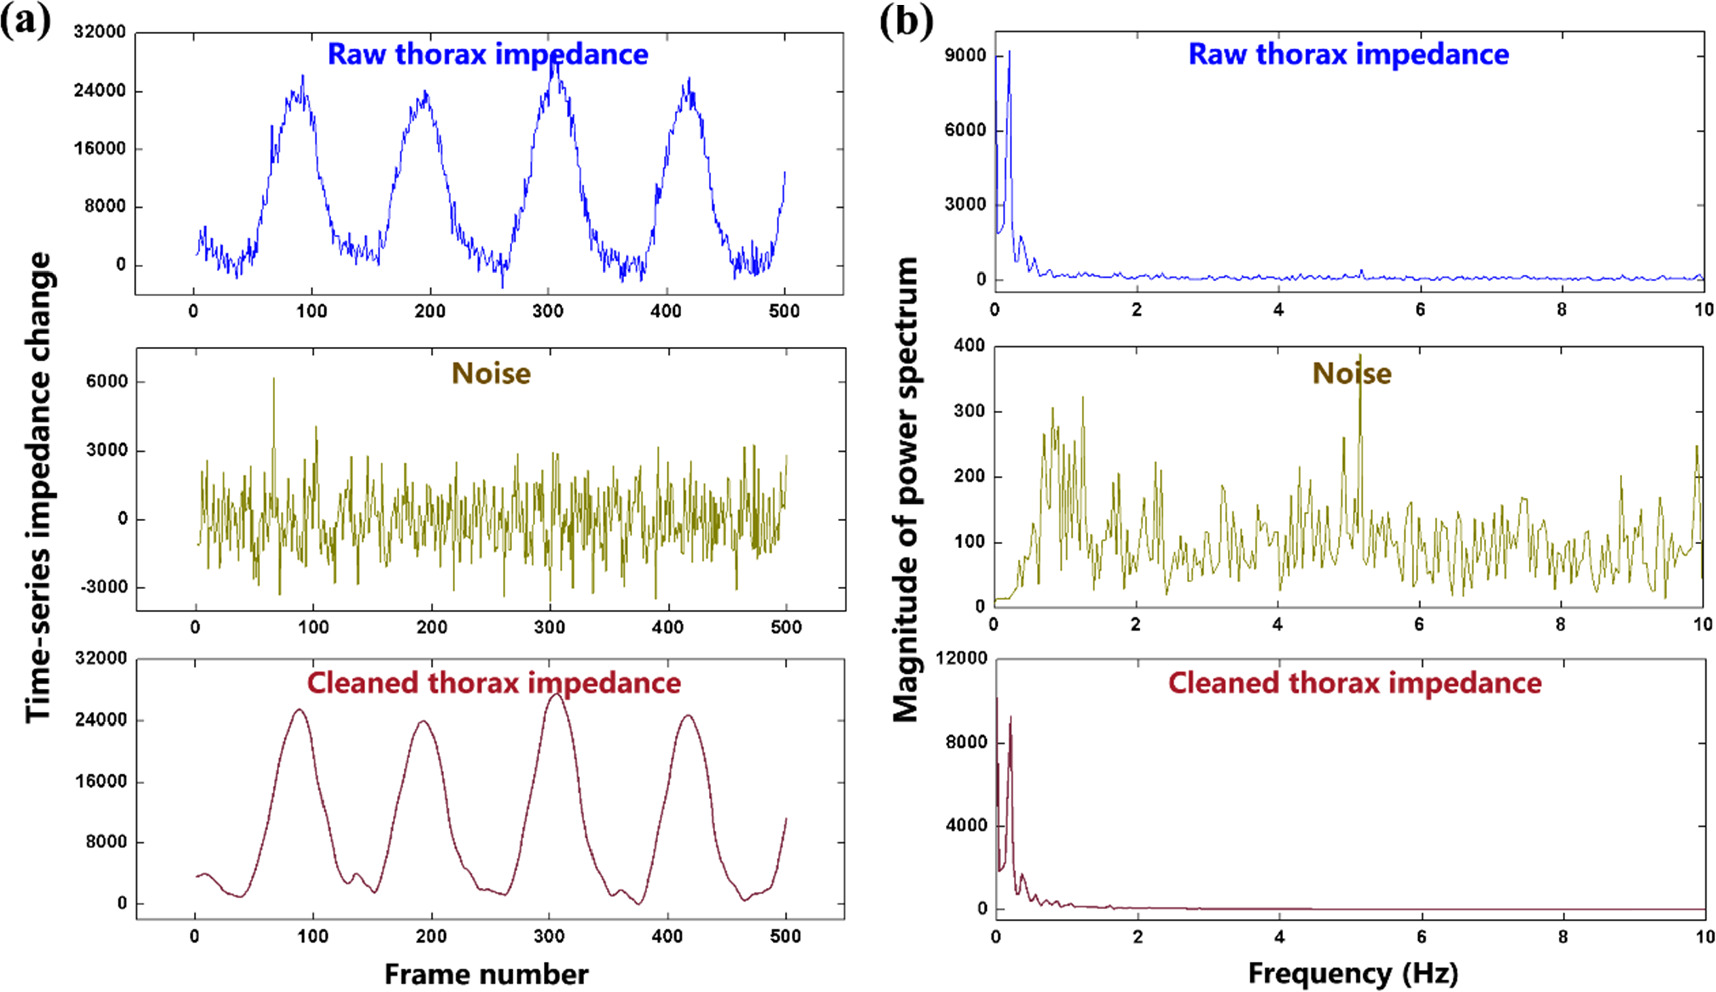
Figure 4. Separation of the respiratory component and noise component for thorax impedance change of Subject #1 with adjacent current injection at 1 mA: (a) the raw thorax impedance, estimated noise and cleaned thorax impedance; (b) the frequency spectrum analysis of the raw thorax impedance, estimated noise and cleaned thorax impedance. For clear demonstration of detailed features of the thorax impedance curve, only 500 frames of data are presented.
Download figure:
Standard image High-resolution imageIn figure 5, the comparison of SNR between opposite and adjacent current injection with different amplitudes of current is presented. Significant SNR differences was found between the two current injections at 1 mA (p = 5.91E-4), 500 uA (p = 3.8E-5), 250 uA (p = 6.1391E-7) and 125 uA (p = 1.0878E-7), as shown in figure 5(a), which indicates a significantly larger SNR for opposite injection than the adjacent injection with the same amplitude of current. Also, the SNR change with varied current amplitude for opposite current injection was significantly different from that for adjacent current injection (F = 38.475, p = 3.876E-10,  ), as shown in figure 5(b), indicating a sharper reduction of SNR magnitude for adjacent current injection.
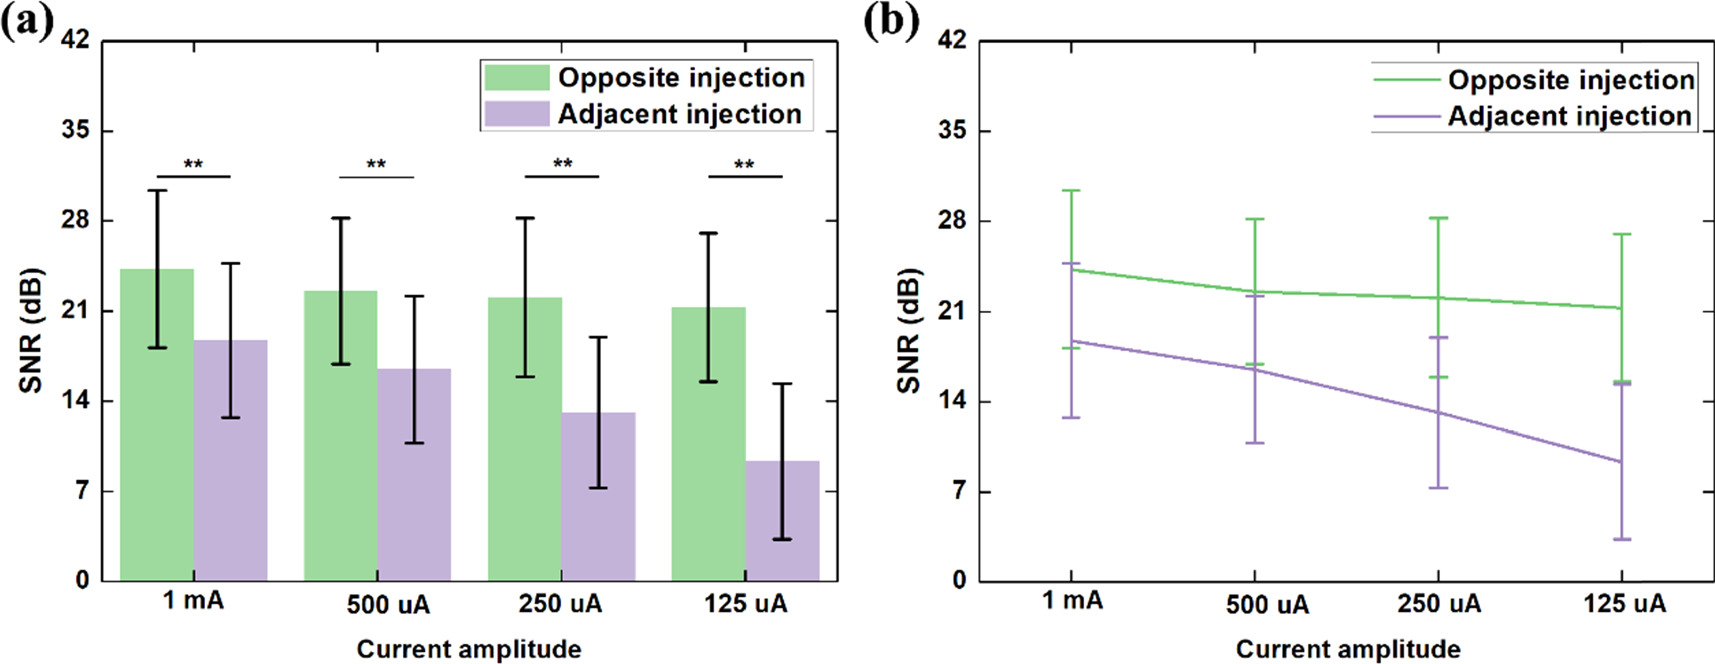
Figure 5. Comparison of SNR between opposite and adjacent current injection with different amplitudes of current: (a) comparison of SNR between opposite and adjacent current injection at 1 mA, 500 uA, 250 uA and 125 uA, respectively; (b) Comparison of SNR change with varied current amplitude between the two current injection patterns. ** p < 0.01.
Download figure:
Standard image High-resolution image3.2. Comparison of EIT image quality
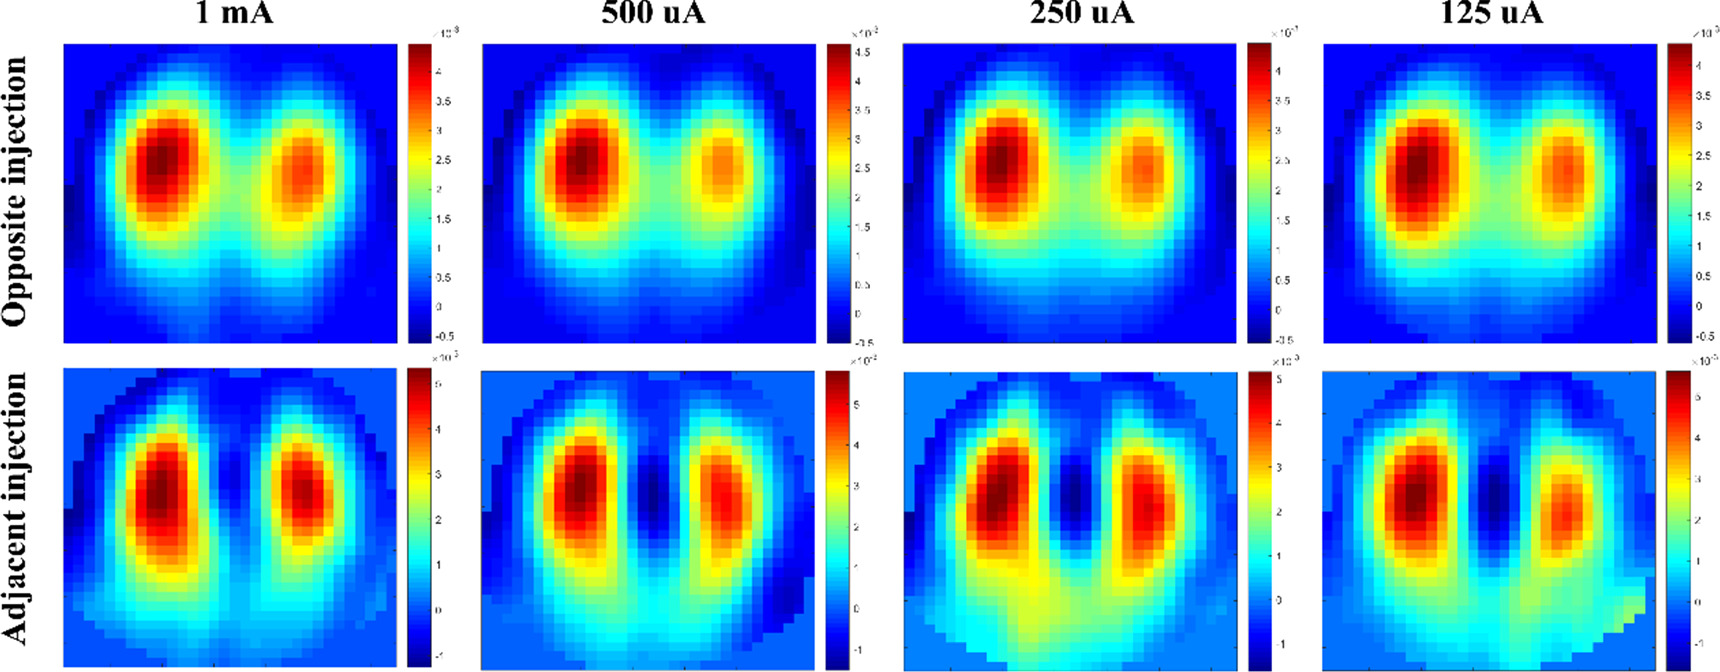
Figure 6 exhibits the fEIT images of Subject #1 for opposite and adjacent injections with four amplitudes of current (1 mA, 500 uA, 250 uA and 125 uA). The ventilation areas in the fEIT images of opposite injection were obviously different from those in the fEIT images of opposite injection. The ventilation areas in the fEIT images of opposite injection were similar across the four current amplitudes, whereas with the decrease of current in adjacent injection, the ventilation areas in the fEIT images changed obviously. Also, apparent artifacts were observed at 250 uA and 125 uA.

Figure 6. The functional EIT images of Subject #1 using the regression-based method for opposite and adjacent injections with four amplitudes of current (1 mA, 500 uA, 250 uA and 125 uA).
Download figure:
Standard image High-resolution imageFigure 7 presents the comparison of fEIT image quality between opposite and adjacent current injection with different amplitudes of current through three metrics. Across the four current amplitudes, lung separation of opposite injection was significantly smaller than that of adjacent injection at each amplitude of current (figure 7(a); p < 0.01). On the other hand, there was no significant difference in lung separation among the four amplitudes of currents for opposite injection. For adjacent injection, a significant difference in lung separation between the 125 uA group and the other three groups was found (p < 0.05 for 1 mA group; p < 0.01 for 500 uA group; p < 0.01 for 250 uA group).
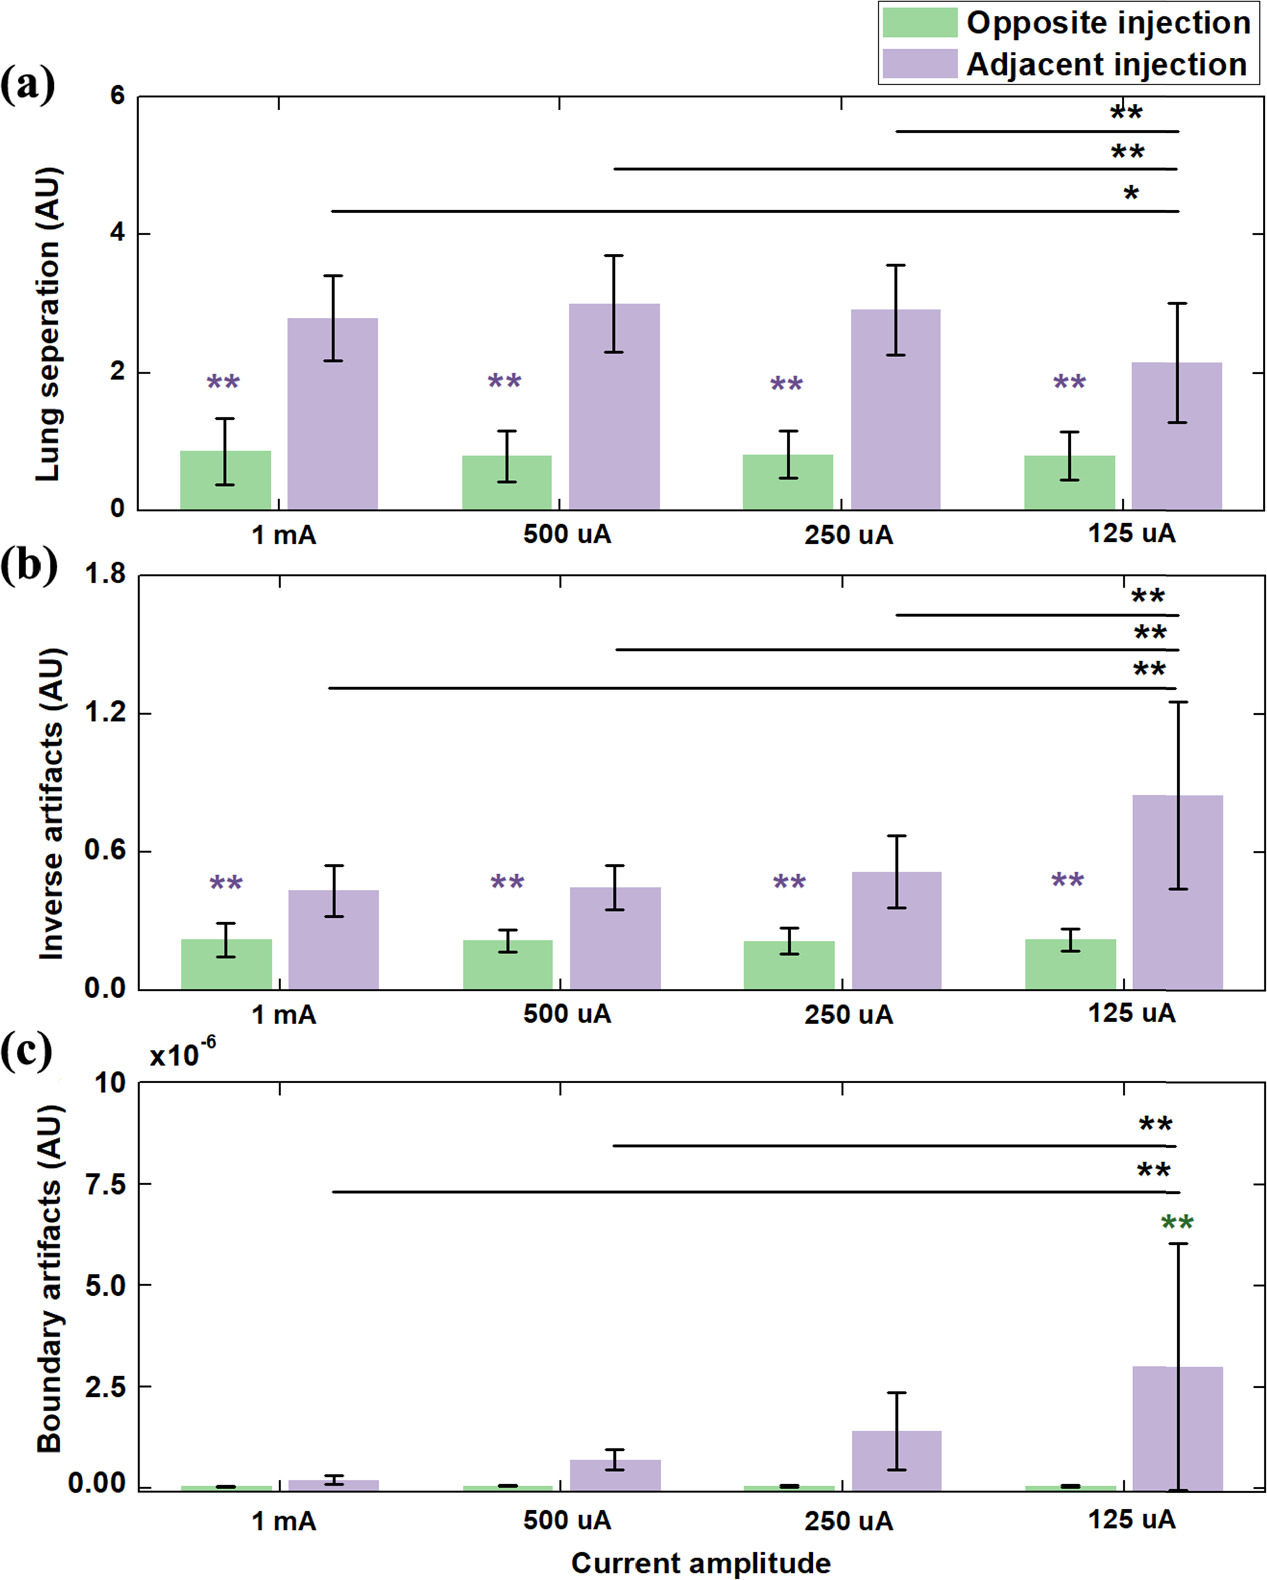
Figure 7. Comparison of image quality of functional EIT images between opposite and adjacent current injection with different current amplitudes using three metrics: (a) lung separation; (b) inverse artifacts; (c) boundary artifacts. **represents significant differences in values between this group and the four groups of adjacent injection (p < 0.01). **represents significant differences in values between this group and the four groups of opposite injection(p < 0.01). ** p < 0.01; * p < 0.05.
Download figure:
Standard image High-resolution imageInverse artifacts of opposite injection at each amplitude of current were significantly smaller than that of adjacent injection (figure 7(b); p < 0.01). For opposite injection, no significant difference in inverse artifacts was found among the four amplitudes of current (p > 0.05). However, for adjacent injection, the value of inverse artifacts increased with the decrease of current amplitude. Significant differences in inverse artifacts were observed between 125 uA and the rest of current amplitudes (p < 0.01).
Last, for the metric of boundary artifacts, the 125 uA group with adjacent injection were significantly higher than the other three groups (figure 7(c); p < 0.01). For opposite injection, decreasing current led to the increase of boundary artifacts, but no significant differences among four groups was found (p > 0.05).
3.3. Comparison of EIT-based clinical parameters
Figure 8 illustrates the comparison of EIT-based clinical parameters with different amplitudes of current for opposite and adjacent current injection.
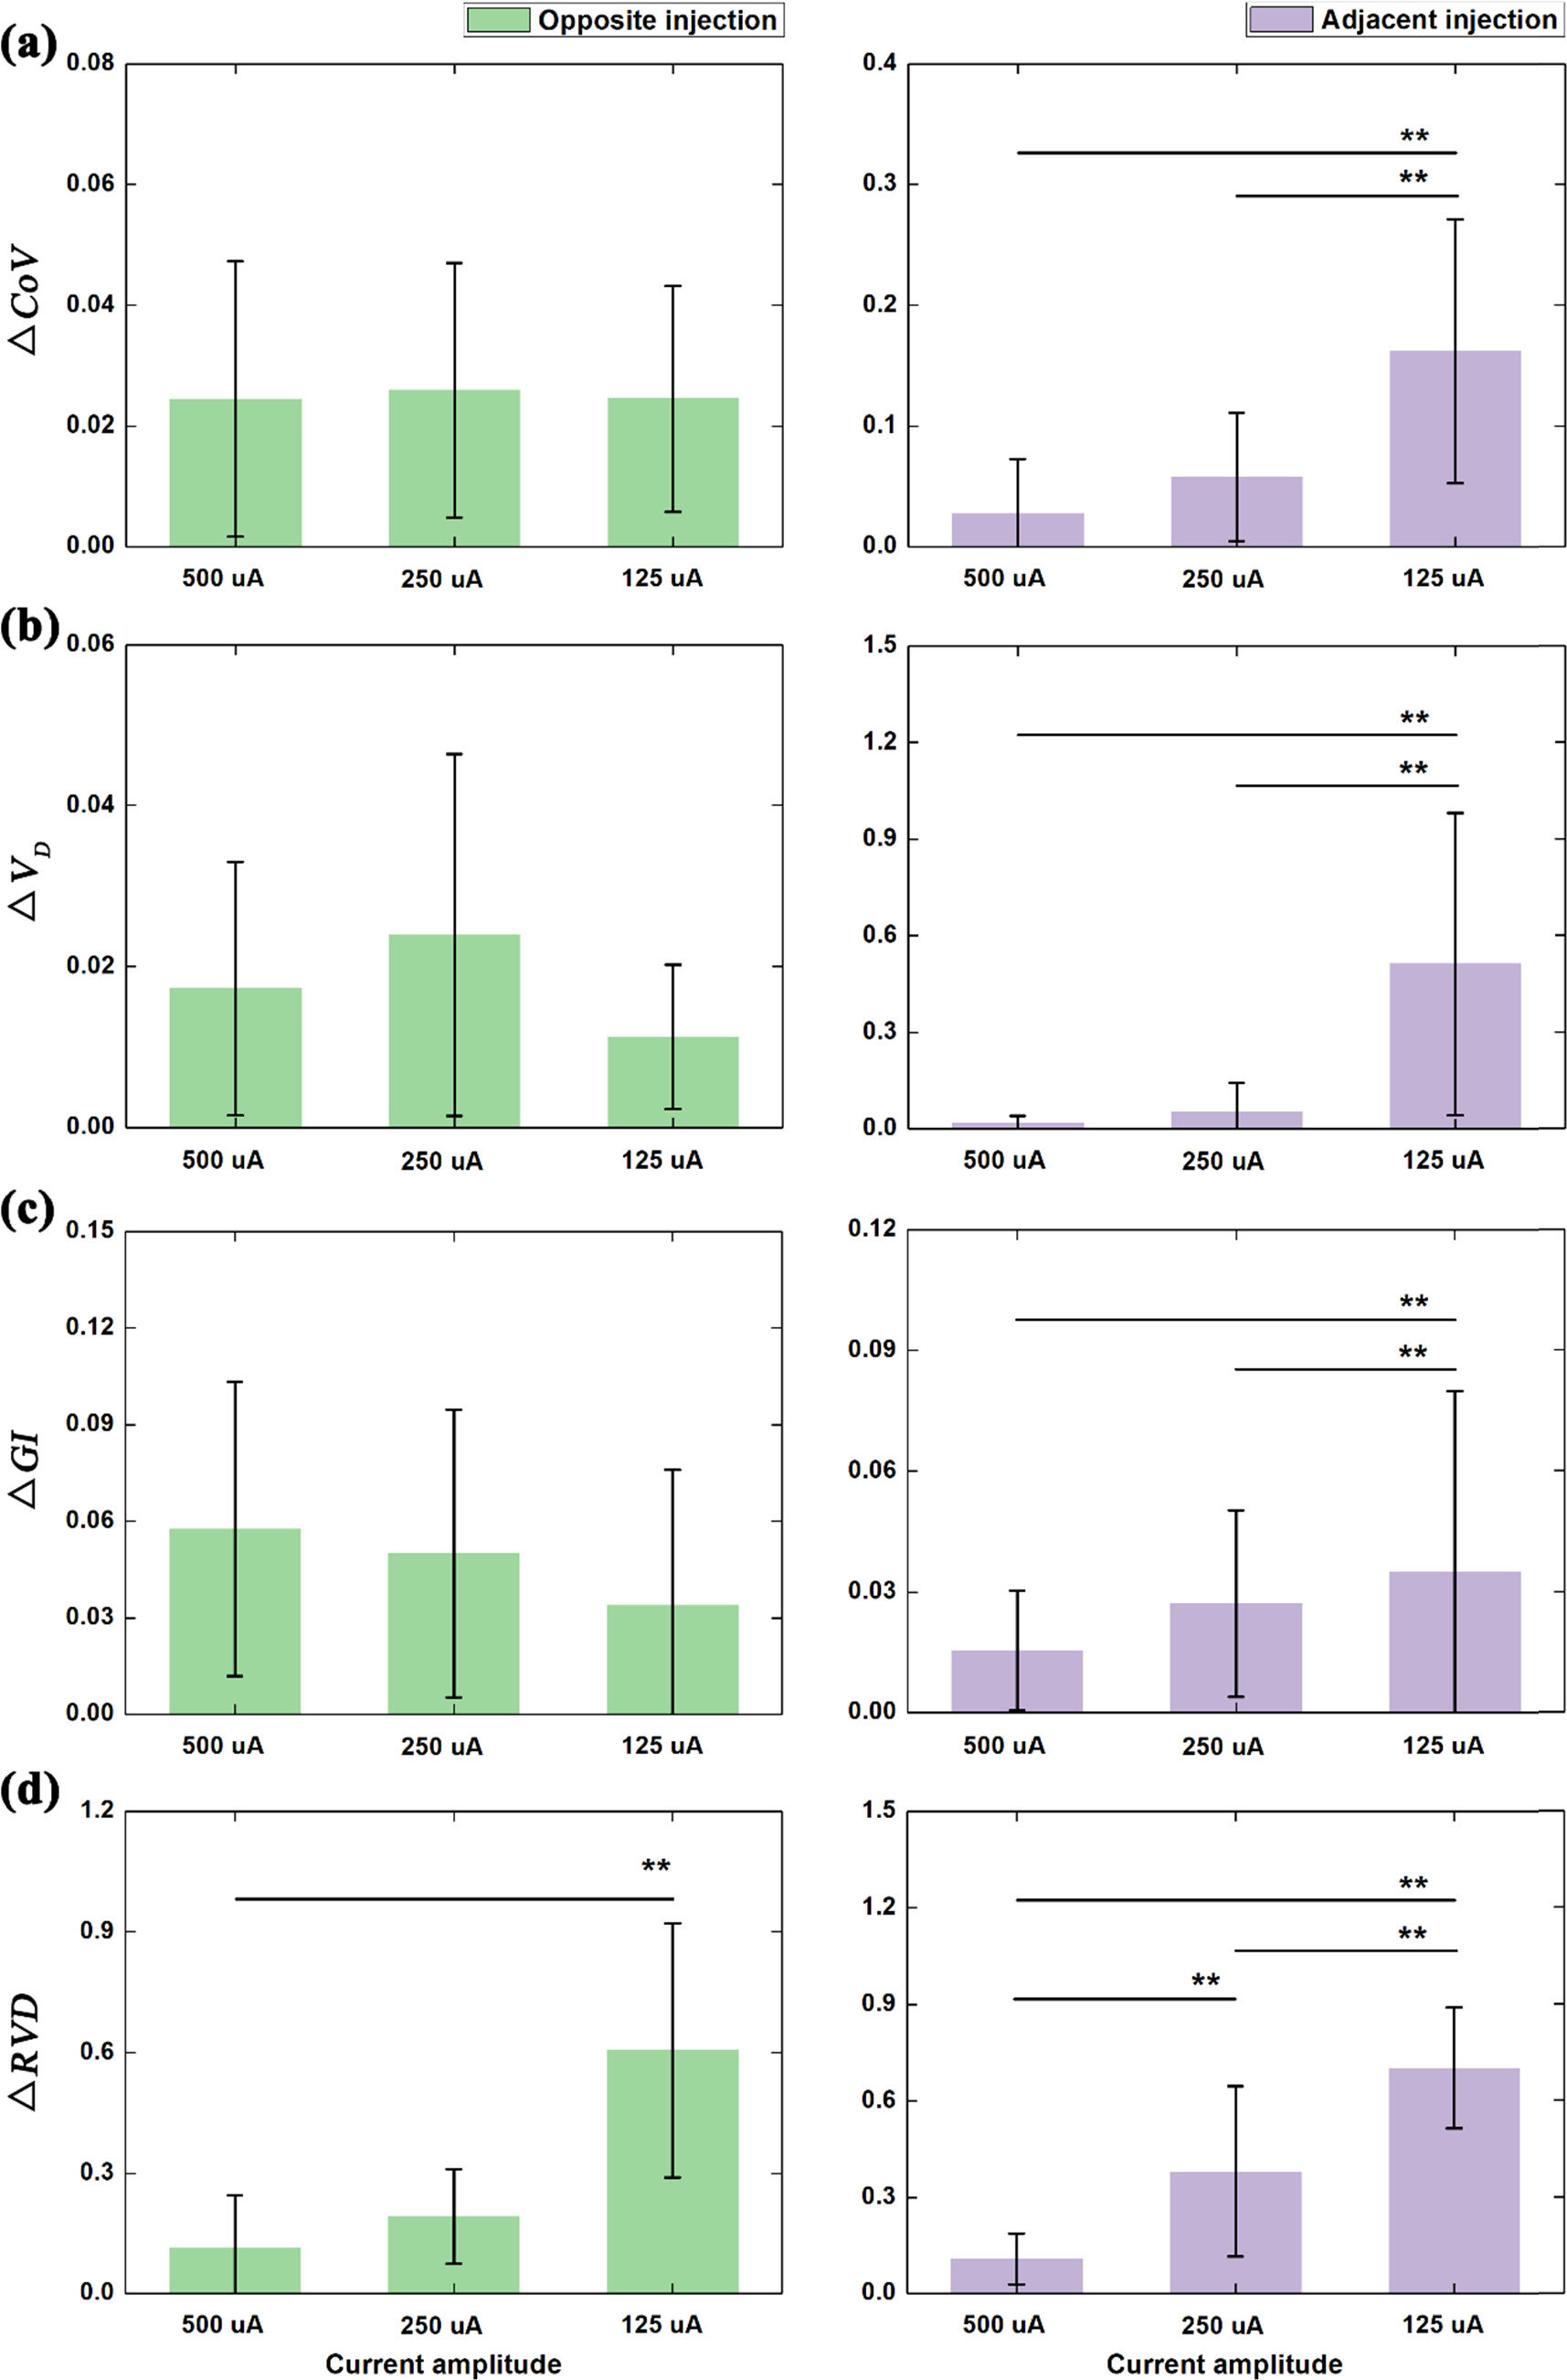
Figure 8. Comparison of EIT-based clinical parameters under different amplitudes of current for opposite and adjacent current injection: (a) the center of ventilation (CoV); (b) dorsal fraction of ventilation (VD); (c) global inhomogeneity (GI) index; standard deviation of regional ventilation delay index (RVDSD).  denotes the relative change of each parameter to the reference defined at 1 mA.
  denotes the EIT-based parameters, and
  indicates the current at different amplitudes, including 500 uA, 250 uA or 125 uA.
Download figure:
Standard image High-resolution imageFor opposite injection, significant differences in  were only found between the 125 uA group and the other two groups (figure 8(d) left; p < 0.01). For
 and
and  no significant difference was found among the three groups (figures 8(a)–(c) left; 500 uA, 250 uA and 125 uA).
For adjacent injection (figure 8 right), significant differences in 

 and
and  between 125 uA, and the other two groups (500 uA and 250 uA) were all found and also there was a significant difference in
  between 500 uA and 250 uA.
4. Discussion
In this study, we proposed 4 EIT data evaluation measures for the first time. Together with 4 clinical EIT parameters we evaluated the performance of adjacent and opposite current injection patterns with four amplitudes. We found that in the context of small currents, opposite injection pattern was superior to adjacent in real subject measurements.
The search for optimal current injection patterns for EIT has been conducted since decades. In two simulation studies, several current injection patterns were compared in a circular phantom with homogeneous distribution of electrical properties (Xu et al 2008, Zhang et al 2010). They concluded that the best angular distance between two excitation electrodes was 158° in a 16-electrode setup (skip-6 setup). Adler et al analyzed various choices of driven patterns for simulated 3D tank and a saline tank (Adler et al 2011). They found that the adjacent stimulation pattern had the poorest performance compared with the patterns separated by over 90°. Bera et al conducted a phantom study and found that the opposite approach had better performance in images reconstruction (Bera and Nagaraju 2012). In another phantom study, configurations of even values of electrode skipping patterns were found better than those of odd values (Luppi Silva et al 2017). Recently, Tarabi et al recommended that in industrial application of EIT for conductive carrier-phases and in large domains, the patterns of opposite current injection and adjacent voltage measurement should be used because the highest correlation of image reconstruction of simulation with experimental data could be obtained with this pattern (Tarabi et al 2022). Russo et al argued that arrangement of the adjacent current injection and the opposite voltage measurement was preferable in the optimization of EIT-based stretchable sensors (Russo et al 2017). Zhang et al quantified the influences of current injection scheme on pulmonary EIT of obese subjects based on a 3D thorax model and found that neighboring electrode pairs used as excitation electrodes could be the most favorable to improve spatial resolution of EIT images (Zhang et al 2020). The performance of opposite and adjacent patterns was contradictory in these studies, but they were evaluated in simulations or phantoms. Clinical performance was not explored. In our systematic analysis, image quality and clinical performance were evaluated. Therefore, the present findings set references for EIT device construction.
4.1. Summary and analysis of experimental results
4.1.1. Assessment of EIT signal quality
The noise level relative to chest impedance increased with the decreasing current for both injection patterns (figures 3 and 5(a)), suggesting that current amplitude could significantly affect the noise level of the measured impedance. This may be related to the characteristics of chest impedance and noise. In EIT measurement, the respiratory impedance could be considered as differential signals proportional to current amplitude, and thus the decreased current directly reduced the amplitude of respiratory impedance. However, noise belongs to common-mode signal, and thus did not decrease proportionally to the current reduction (Li et al 2019b). Additionally, compared with opposite injection, adjacent injection had smaller SNR with the same amplitude of current (figure 5(a)) and SNR of adjacent injection decreased faster than that of opposite injection (figure 5(b)), which suggested better SNR performance of opposite injection within a small current. This may be attributed to the difference in the measurement principle of the two injection patterns. In the potential field of EIT, current is distributed dominantly near the excitation electrodes and thus the resulting potential decreases as the measurement electrode is located further away from the excitation electrodes (Wu et al 2021), as shown in figure 9. Because the voltmeter has the same noise power, SNR of the measured impedance at the far-end electrode becomes smaller compared to that at the near-end electrode (Li et al 2023). In terms of the distance between electrodes of measurement and electrodes, there are more electrodes far from the excitation electrodes in adjacent injection than those in opposite injection; therefore, the impedance obtained from these measurement channels was much smaller than that with opposite injection (figure 9). As a result, SNR of the whole chest impedance with adjacent injection was smaller than that with opposite injection when current of the same amplitude was applied.
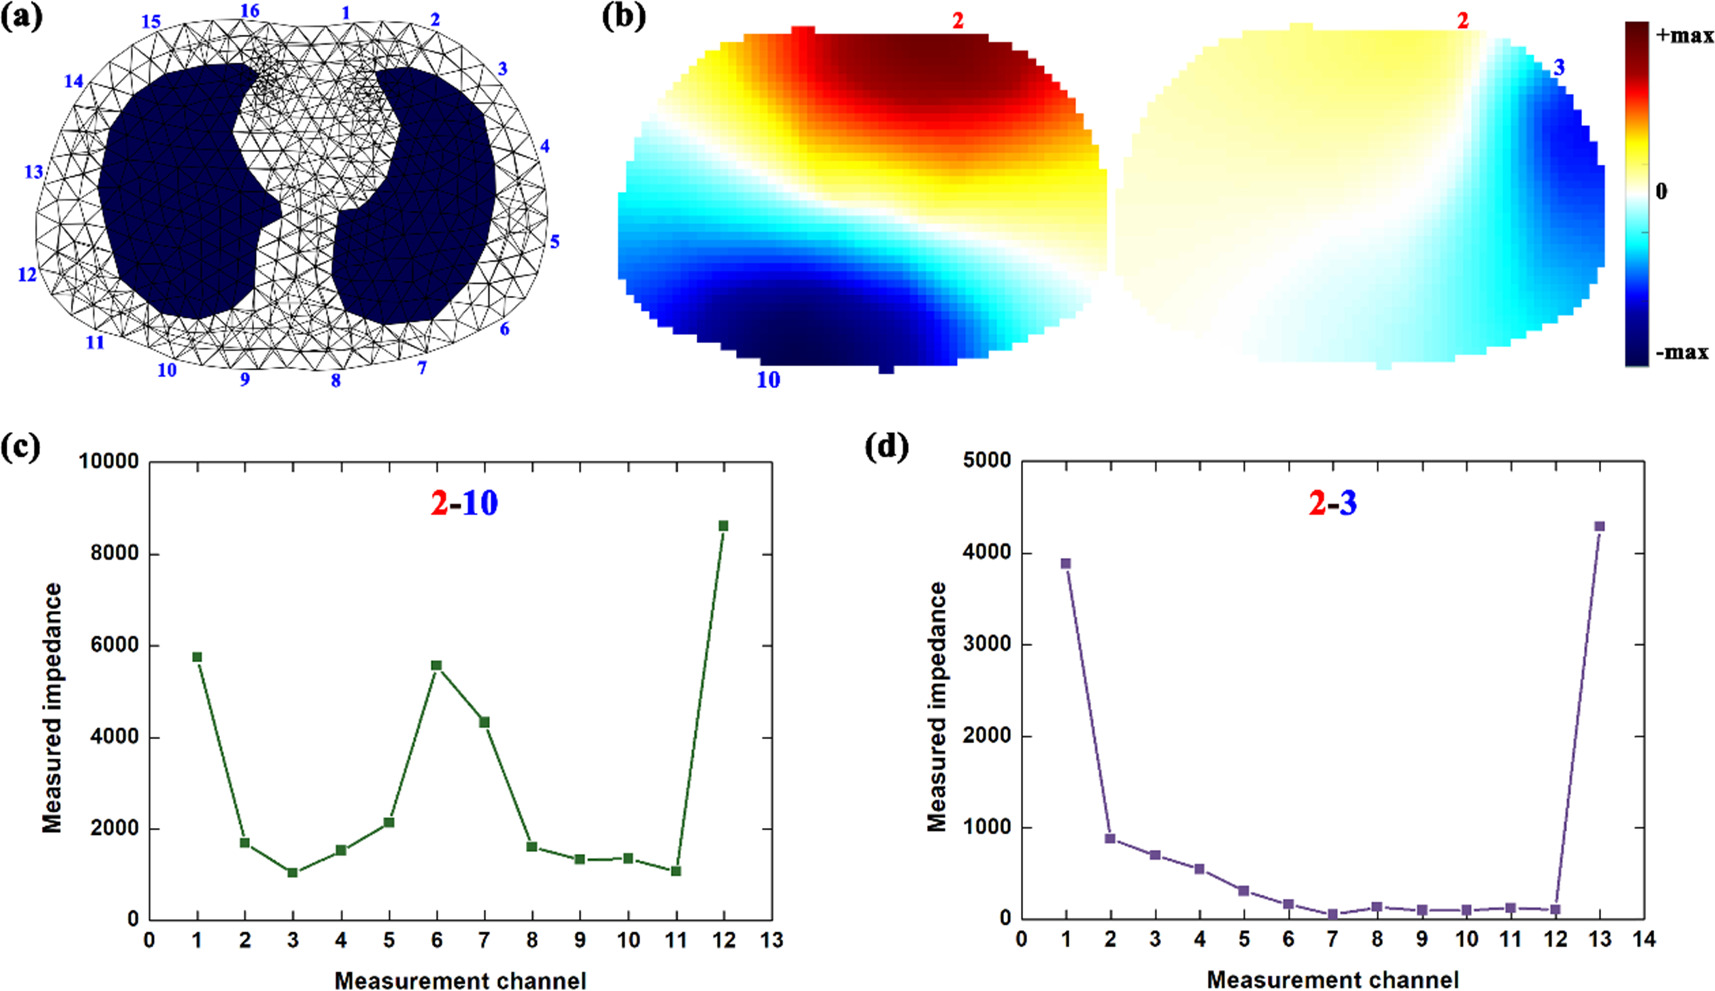
Figure 9. EIT measurements analysis: (a) a simulated thorax model established based on the CT image at the 4–5th intercostal space of one healthy male, which was used to reconstruct EIT images in this study; (b) potential distribution with opposite injection (Electrode 2 and 10) and adjacent injection (Electrode 2 and 3); (c) measured impedance (digital values) with opposite injection (Electrode 2 and 3); (d) measured impedance (digital values) with adjacent injection (Electrode 2 and 10).
Download figure:
Standard image High-resolution image4.1.2. Assessment of EIT image quality
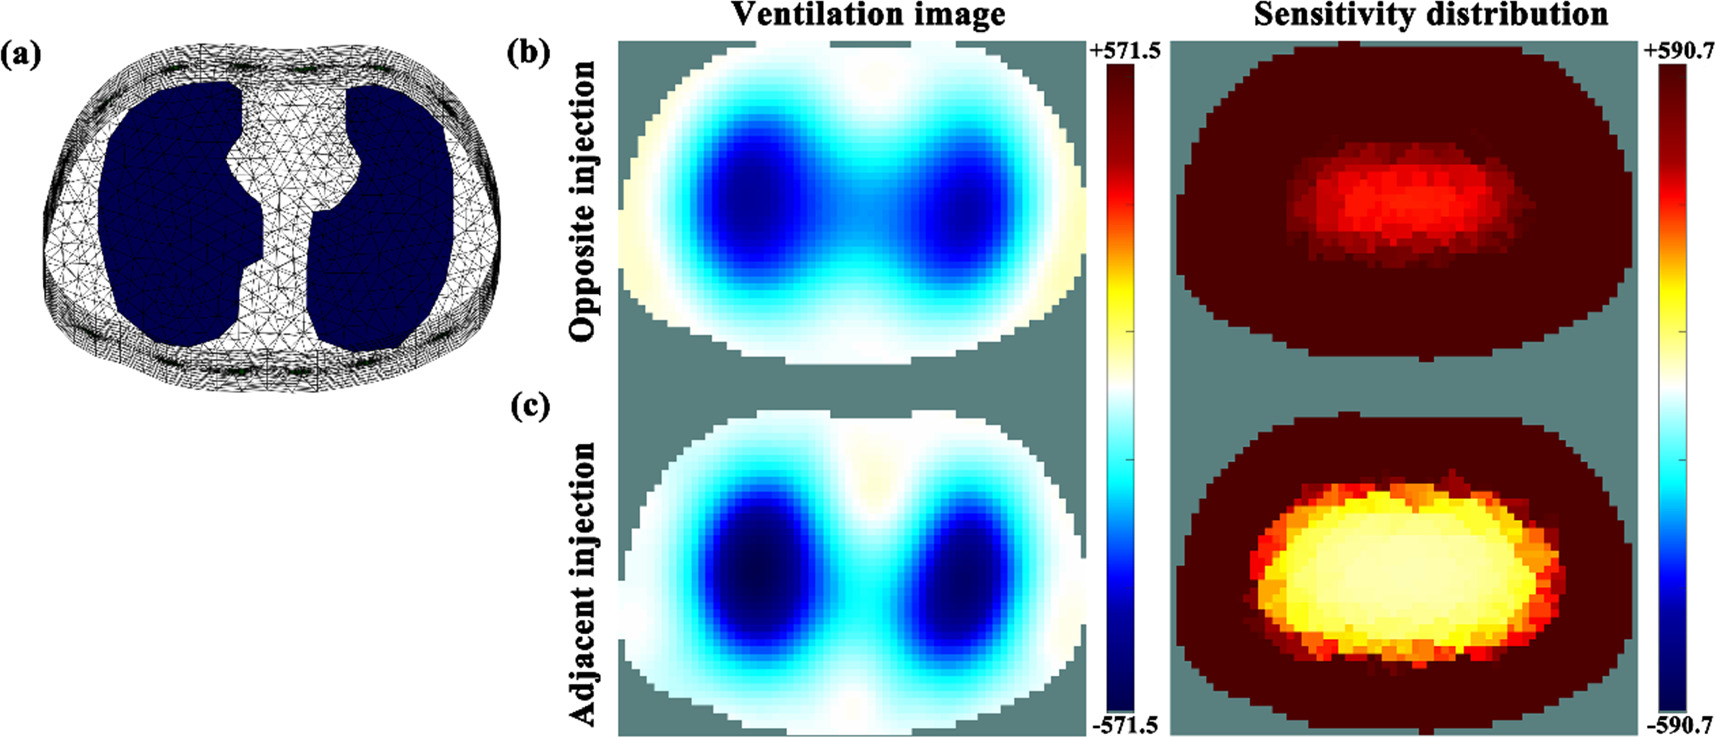
A significantly higher value of lung separation at the same amplitude of current (p < 0.01) was found in the fEIT images acquired with adjacent injection than those with opposite injection, suggesting that adjacent injection had improved resolution within the central area of the chest. This may be due to the difference in sensitivity distributions inside the chest with the two injection patterns. Figure 10 shows the image reconstruction of simulated lung ventilation for adjacent and opposite injection and their sensitivity distributions inside the chest. Similar to the reconstructed images of humans using the GREIT algorithm (NF = 0.5), adjacent injection had better lung separation compared to opposite injection (figure 6). Sensitivity distribution indicated that the sensitivity of opposite injection within the central area of the chest was higher than that of adjacent injection, i.e., the boundary potentials of the opposite injection were more sensitive to impedance change within the central area of the chest. In addition, because of the essential characteristics of low spatial resolution of EIT (Hentze et al 2021), the reconstructed values within the central area of the chest in the EIT image of opposite injection were larger than those of adjacent injection, which exhibited the relatively worse lung separation of opposite injection (Adler and Zhao 2023).
Figure 10. Numerical simulations of characteristics of lung separation for adjacent and opposite injection: (a) simulated thorax model established based on the CT image at the 4–5th intercostal space of one healthy male, which was used to reconstruct EIT image in this study; (b) reconstructed ventilation image with opposite injection using the GREIT algorithm (NF = 0.5), in which the conductivity of the two lung regions was changed from 1 to 0.3 S m−1, and its sensitivity distribution by normalizing EIT measurements for each element, ![${S}_{i}=\sqrt{sum\left[{\left({{\bf{J}}}_{i}^{1}\right)}^{2},\,{\left({{\bf{J}}}_{i}^{2}\right)}^{2},\ldots ,{\left({{\bf{J}}}_{i}^{n}\right)}^{2}\,,\ldots ,{\left({{\bf{J}}}_{i}^{208}\right)}^{2}\right]}/{\upsilon }_{i},$](https://content.cld.iop.org/journals/0967-3334/45/2/025004/revision2/pmeaad2215ieqn115.gif) in which
in which  was the sensitivity value of the
  element of the EIT measurements,
  denoted the sensitivity matrix,
  was the sensitivity value of the
  element in the
  EIT measurement and
  represented the volume of the
  element; (c) reconstructed ventilation image with adjacent injection using the GREIT algorithm (NF = 0.5) and its sensitivity distribution obtained with the same computational method stated above. Note: the two ventilation images share the same colorbar while the two sensitivity distribution images shared the same one. The sensitivity of opposite injection within the central area of the chest was higher than that of adjacent injection.
Download figure:
Standard image High-resolution image
For inverse artifacts at the same amplitude of current, a significant higher value (p < 0.01) was observed in the fEIT image when adjacent injection was applied instead of opposite injection, which indicates greater inverse artifacts produced by adjacent injection. The most plausible explanation for this phenomenon is the property of reconstruction algorithm together with the specific sensitivity distribution of adjacent injection. Ring artifacts are inevitable in EIT image reconstruction, which appear as areas with opposite sign surrounding lung ventilation regions, like the yellow area in the ventilation image of figure 10. Ring artifacts are typical of linear filter and also be called 'overshoot' for second-order systems  such as Gauss-Newton reconstruction approaches and the GREIT algorithm used in this study (Adler et al
2009, Adler et al
2011). Further, for ventilation imaging, the magnitude of ring artifacts between two lungs was enhanced by the superposition of ring artifacts derived from the ventilation regions on both sides because the bilateral lung ventilation could be viewed as two large imaging targets. Nevertheless, the lower sensitivity of adjacent injection within the central area of the chest could result in a smaller change of reconstructed impedance compared with opposite injection. Eventually, in the case of adjacent injection, ring artifacts of larger magnitude might exceed smaller impedance change, which showed up more inverse artifacts in ventilation images with adjacent injection. EIT is a functional imaging technique, not a structural imaging method like CT. The important reason is that during the EIT data collection process, the electrical current applied to the human thorax through surface electrodes does not flow in a straight line within the thorax. Furthermore, different patterns of current injection will form different current paths, which results in different sensitivity distributions. In other words, the different current injection patterns have different sensitivity to the same impedance change. As shown in figure 10 of the manuscript, the sensitivity distribution between opposite and adjacent current injections were different, so the locations of lungs between two injection patterns were different.
such as Gauss-Newton reconstruction approaches and the GREIT algorithm used in this study (Adler et al
2009, Adler et al
2011). Further, for ventilation imaging, the magnitude of ring artifacts between two lungs was enhanced by the superposition of ring artifacts derived from the ventilation regions on both sides because the bilateral lung ventilation could be viewed as two large imaging targets. Nevertheless, the lower sensitivity of adjacent injection within the central area of the chest could result in a smaller change of reconstructed impedance compared with opposite injection. Eventually, in the case of adjacent injection, ring artifacts of larger magnitude might exceed smaller impedance change, which showed up more inverse artifacts in ventilation images with adjacent injection. EIT is a functional imaging technique, not a structural imaging method like CT. The important reason is that during the EIT data collection process, the electrical current applied to the human thorax through surface electrodes does not flow in a straight line within the thorax. Furthermore, different patterns of current injection will form different current paths, which results in different sensitivity distributions. In other words, the different current injection patterns have different sensitivity to the same impedance change. As shown in figure 10 of the manuscript, the sensitivity distribution between opposite and adjacent current injections were different, so the locations of lungs between two injection patterns were different.
In terms of boundary artifacts at the same amplitude of current, the fEIT image of adjacent injection has a significantly higher value than that of opposite injection, indicating that adjacent injection could cause more boundary artifacts. Particularly for this pattern of injection, significant differences in boundary artifacts were found between the 125 uA group and the other three groups for adjacent injection as well. The probable explanation for this may be that adjacent injection had a lower SNR, that is to say, there was a relatively higher level of noise in the EIT measurement, which may originate from the intrinsic of internal components of the hardware system, the high-frequency noise caused by distributed capacitance formed by the circuit wiring of the hardware system, or external electromagnetic interference through electrode wires or human body coupling (Hong et al 2015, Li et al 2019b, Wu et al 2019). From the perspective of EIT image reconstruction, these measurement noises could be regarded as equivalent to the impedance change within regions near electrodes, which would be finally converted to boundary artifacts in the reconstructed images. Therefore, the lower SNR, the more boundary artifacts.
4.1.3. Assessment of EIT-based clinical parameters
For opposite injection, except for  between the 125 uA group and the other two groups, the rest of the clinical parameters did not change significantly with the amplitude of current. For adjacent injection,
 and
and  had significant changes when the amplitude of current decreased to 125 uA, and
  changed significantly once the current varied. These results suggested that the pattern of opposite injection performed better to maintain stable clinical parameters with the small currents compared with adjacent injection. In addition,
  was found to be the most sensitive parameter for current amplitude for both current injection patterns.
Because 
 and
and  were obtained from the fEIT image calculated by using the time-series EIT images throughout the respiratory cycle, these three parameters were determined by the respiratory phase.
  was obtained from the time-series EIT images in the inspiratory phase, so it was determined by the inspiratory phase. In this study, the participants were asked to maintain a sitting position with calm breathing throughout the whole data acquisition period. Accordingly, the time-series EIT images for each subject were periodically stable and thus the four clinical parameters were also stable.
4.2. Considerations for wearable EIT application
In terms of SNR of thorax impedance, EIT image quality and EIT-based clinical parameters, the patterns of opposite and adjacent current injection have different responses to the small amplitude of current used in the wearable EIT system. Overall, the opposite injection outperforms the adjacent injection with the same amplitude of current, except for lung separation if it is desirable. For opposite current injection, currents greater than 250 uA were suggested to ensure the reliability of EIT-based clinical parameters because  became unstable when the current dropped to 125 uA. For adjacent current injection, currents greater than 500 uA were recommended to ensure a high level of SNR, a high quality of reconstructed image as well as a high reliability of clinical parameters because these evaluation metrics performed well at currents >500 uA.
In this present study, we used a commercial EIT system to collect chest EIT data from each subject with adjacent and opposite injection using four amplitudes of current. For small currents required by wearable EIT, the most critical way to enhance the image quality is to improve the measurement quality, which could be achieved by the improvement of SNR for both patterns. Apart from chest impedance, EIT measurements are also sensitive to all types of interferences in the EIT system. Hence it is essential to minimize the interferences in each module of EIT system, if possible, to improve SNR of EIT measurements. As for the current source, specific structure should be designed to reduce the common-mode signal as well as to improve the noise suppression ability, such as the bipolar-mirror feedback current source with a differential mirror circuit and programmable current source with a digital synthesis technique (Shi et al 2018, Li et al 2019b). As for the voltmeter, it is desirable to implement automatically regulation of the gain by the amplitude of measurement value to reduce noise effect on signal quantization through purposeful designs. The entire dynamic range of the ADC (analog to digital converter) can thus be fully used by amplifying all measured voltages into accessible ranges of the post-stage circuit, such as the programmable gain instrumentation amplifier (Teng and Odame 2014, Li et al 2023). Furthermore, as for the electrode leads, the shielded cables may help to reduce coupling of interference between electrode cables (Soleimani 2006, Gaggero et al 2012, Abdelwahab et al 2020).
In this study, the famous GREIT algorithm developed for lung ventilation imaging was used to reconstruct ventilation EIT images. To compare the performance of both current injection patterns, the same algorithm hyperparameter was adopted to calculate the reconstruction matrix, i.e. noise figure (NF) = 0.5, which was defined as the ratio of SNR of the raw EIT measurement to that of the reconstructed image (Adler et al 2009). For reconstruction of EIT images, regularization was typically used and the algorithm hyperparameter controlled the degree of regularization. The algorithm hyperparameter aims to make EIT images more robust to noise and interference, which can be regarded as a trade-off parameter between noise rejection and accuracy (Liu et al 2013, Braun et al 2017). As a result, it should be beneficial to the improvement of the quality of reconstructed image in practice to individually select appropriate algorithm hyperparameter based on the noise level of EIT measurement (Li et al 2018, Graham and Adler 2006, Li et al 2019a) and to choose the optimal current injection pattern by adopting image noise evaluation strategies, such as the versatile noise performance metric based on average SNR in the image domain (Braun et al 2017). Additionally, to reduce image noise and artifacts, research groups are encouraged to employ novel regularization methods and reconstruction algorithms capable of strong noise suppression, such as compressive sensing and machine learning (Hamilton and Hauptmann 2018, Shiraz et al 2019, Fan and Ying 2020).
4.3. Limitations of this study
In this study, the number of subjects recruited in the experiments was limited and all volunteers had similar demographics (i.e. young male subjects, BMI:22.8 ± 3.6). All EIT measurements were performed with the sitting position only. However, the objective comparisons of adjacent and opposite injection patterns were achieved under identical experimental conditions. Since the chest anatomy might influence the EIT measurement, in the future, the performance of the two current injection patterns should be further explored in a broader population with different age, gender and BMI, as well as different body positions. Additionally, the chest EIT data were collected in the laboratory environment, whereas EIT measurements should be carried out in clinical settings because of its complex electromagnetic environment. Furthermore, the chest EIT data was recorded for a short time (∼2 min) in this study, but some practical problems might occur during the long-term monitoring with EIT, such as the condition change between electrode and skin. Thus, it is necessary to analyze the chest EIT data collected over a long period for comprehensive evaluation of adjacent and opposite injection patterns. Moreover, the performances of the two injection patterns were evaluated, but new injection patterns were not explored, like combining different current injections patterns.
Previous studies have shown that the mismatch between the true body shape and the one used for reconstruction is known to introduce errors. For example, Grychtol et al quantified the errors resulting from reconstruction shape mismatch and concluded that EIT reconstruction accuracy could be reduced for torso (thorax) shape errors as little as 4% (Grychtol et al 2012). In another study, Schullcke et al demonstrated that the use of lung and torso shapes from patient CT images could significantly improve reconstruction accuracy, such as reducing the blurring artifacts (Schullcke et al 2016). In this study, due to the absence of the CT or MRI images, an accurate reconstruction model for each subject was not established to carry out EIT image reconstruction. As a result, reconstruction errors inevitably existed in the reconstructed EIT images. But the purpose of this study was to compare the performance of current injection patterns with various low-amplitude currents. For each subject, the same thorax shape was used to establish the reconstruction model in the image reconstruction of both injection patterns and thus reconstruction errors caused by model mismatch was considered to be the same for both injection patterns. Consequently, our conclusions were reliable by comparing the image parameters of both current injection patterns.
In this study, we compared the EIT-based clinical parameters at various current amplitudes by using the parameters at 1 mA as the reference with the assumption that the EIT images at the maximum current could most sensitively reflect the impedance induced by ventilation. So far, numerous studies have validated the clinical values of the EIT-based parameters in evaluating physiological and pathophysiological conditions of the lungs, such as GI for identifying increased ventilation inhomogeneity in patients with COPD and RVD for guiding PEEP optimization (Girrbach et al 2020, Frerichs et al 2021). Additionally, a comparative study between a commercial EIT system (PulmonVista500, current of 5 mA at 50 kHz) and a portable EIT system (current of 1 mA at 50 kHz) on 9 healthy volunteers for ventilation monitoring concluded that both systems delivered comparable images in regional ventilation distribution (Yang et al 2021b). These studies indirectly suggested feasibility of using EIT-based clinical parameters obtained at 1 mA to evaluate regional lung ventilation. But the correlation of these clinical parameters obtained at 1 mA to the real clinical physiology has not been directly validated.
5. Conclusion
To ensure a high level of SNR, a high quality of reconstructed image as well as a high reliability of clinical parameters, currents greater than 250 uA were suggested for opposite current injection pattern, while currents greater than 500 uA were recommended for adjacent current injection pattern. In general, opposite current injection pattern was superior to the adjacent pattern in a setting of small current amplitude.
Acknowledgments
The work was partially supported by National Natural Science Foundation of China (NSFC 61901478, 52077216 and 51837011), Medical Program of FMMU (2019ZTC01), Equipment Program of PLA (Grant No. KJ2018–2019C132) and Natural Science Foundation of Shaanxi Province, China (2023-YBSF-130).
Data availability statement
All data that support the findings of this study are included within the article (and any supplementary information files).
Authorship contribution
Lin Yang: Conceptualization, Writing—original draft, Supervision, Project administration. Lin Yang, Zhijun Gao, Chunchen Wang, Hang Wang, Jing Dai: Conceptualization, Methodology, Writing—original draft, Formal analysis. Gang Zhu: Software, Validation. Lin Yang, Zhijun Gao, Yilong Qin, Meng Dai, Xinsheng Cao: Writing—review and editing, Resources, Investigation. Lin Yang, Meng Dai, Zhanqi Zhao: Visualization, Data curation. Lin Yang, Zhanqi Zhao: Resources, Investigation.
Conflict of interest
The authors declare that they have no competing interests.