Article

Climate Change Effects on Heat Waves and Future Heat Wave-Associated IHD Mortality in Germany

by
Stefan Zacharias
1,*,
Christina Koppe
1 and
Hans-Guido Mücke
2
1
Deutscher Wetterdienst (German Meteorological Service), Center for Biometeorological Research (ZMMF), Stefan-Meier-Str. 4, 79104 Freiburg, Germany
2
Federal Environment Agency, Department Environmental Hygiene, Corrensplatz 1, 14195 Berlin, Germany
*
Author to whom correspondence should be addressed.
Climate 2015, 3(1), 100-117; https://doi.org/10.3390/cli3010100
Submission received: 26 November 2014 / Accepted: 17 December 2014 / Published: 26 December 2014
(This article belongs to the Special Issue Climate Impacts on Health)

Abstract

:
The influence of future climate change on the occurrence of heat waves and its implications for heat wave-related mortality due to ischemic heart diseases (IHD) in Germany is studied. Simulations of 19 regional climate models with a spatial resolution of 0.25° × 0.25° forced by the moderate climate change scenario A1B are analyzed. Three model time periods of 30 years are evaluated, representing present climate (1971–2000), near future climate (2021–2050), and remote future climate (2069–2098). Heat waves are defined as periods of at least three consecutive days with daily mean air temperature above the 97.5th percentile of the all-season temperature distribution. Based on the model simulations, future heat waves in Germany will be significantly more frequent, longer lasting and more intense. By the end of the 21st century, the number of heat waves will be tripled compared to present climate. Additionally, the average duration of heat waves will increase by 25%, accompanied by an increase of the average temperature during heat waves by about 1 K. Regional analyses show that stronger than average climate change effects are observed particularly in the southern regions of Germany. Furthermore, we investigated climate change impacts on IHD mortality in Germany applying temperature projections from 19 regional climate models to heat wave mortality relationships identified in a previous study. Future IHD excess deaths were calculated both in the absence and presence of some acclimatization (i.e., that people are able to physiologically acclimatize to enhanced temperature levels in the future time periods by 0% and 50%, respectively). In addition to changes in heat wave frequency, we incorporated also changes in heat wave intensity and duration into the future mortality evaluations. The results indicate that by the end of the 21st century the annual number of IHD excess deaths in Germany attributable to heat waves is expected to rise by factor 2.4 and 5.1 in the acclimatization and non-acclimatization approach, respectively. Even though there is substantial variability across the individual model simulations, it is most likely that the future burden of heat will increase considerably. The obtained results point to public health interventions to reduce the vulnerability of the population to heat waves.

1. Introduction

Heat is a well-known weather-related hazard and has been associated with increases in both mortality and morbidity [1,2]. Heat waves, defined as extended periods of extreme high temperature, are regarded as one of the primary weather-associated threats to human life [3]. For instance, the excess mortality during the extremely hot summer of 2003 in Europe was estimated to be about 50,000 [4]. The relationship between heat waves and mortality has been widely studied in the literature (e.g., [5]). Generally, the strongest heat effects are observed among the elderly [6]. Additionally, some studies also report stronger heat-related impacts on women than on men [7]. Furthermore, heat affects human health in various aspects. In particular, persons with cardiovascular or respiratory diseases are at enhanced risk from heat exposure [8]. Some authors also analyze heat wave characteristics and find that heat impacts on mortality depend on the intensity, length, and timing in season of heat waves [9,10].
The pathophysiological mechanisms of the heat impact on the human body involve dehydration, increased blood viscosity and an impairment of the endothelial function, which enhances the risk for thrombo-embolic diseases and cardiovascular events [11,12]. Generally, the work required to maintain thermoregulation is increased during heat, which stresses the cardiovascular system [13]. However, humans are able to acclimatize to hot weather by e.g. increasing their sweat rate or decreasing their metabolic and heart rate [14].
Since climate change will most likely enhance the number, intensity, and duration of heat waves [15], heat-related mortality has become a matter of growing public health concern [16]. Most studies agree in an increase of future heat-related mortality [16,17,18], but the results differ considerably in the extent of the projected climate change impact. The observed uncertainties are not only due to different heat wave definitions and heat-mortality relationships, but depend also on the applied temperature projections based on the choice of model simulations and emission scenarios. Therefore, the results show large geographical heterogeneity among different countries or regions and are not directly comparable.
Risk assessments of heat impact on human health in its various aspects play an important role in order to prepare for the future and to minimize the temperature-related health effects in a changing climate. Quantitative evaluation of present-day and future heat wave-associated mortality in Germany was reported to have been insufficient so far [19]. Furthermore, climate change effects on heat-related cause-specific mortality are investigated rarely to date.
In the first part of our nationwide study, we recently analyzed the influence of heat waves on ischemic heart diseases in Germany during 2001–2010 [20]. The results show that IHD mortality during heat wave days is significantly increased by about 15% compared with non-heat wave days. Furthermore, longer and more intense heat waves feature stronger effects on IHD mortality, while timing in season turned out to be less important.
In the present second part of our study, the impact of climate change on the occurrence of heat waves in Germany is investigated based on 19 regional model simulations driven by the Intergovernmental Panel on Climate Change (IPCC) scenario A1B [21]. The use of an ensemble approach strengthens the reliability of the results and enables a specification of the range of modelling uncertainty. Future changes in heat wave characteristics, including the frequency, intensity, and duration of heat events, are studied. Furthermore, climate change impacts on IHD mortality in Germany are analyzed applying present-day heat wave-mortality relationships evaluated in [20] and implementing two potential acclimatization approaches to heat. The paper is organized as follows: a description of the data and methods used is given in Section 2, results are presented in Section 3, followed by a discussion and concluding remarks in Section 4.

2. Data and Methods

2.1. Mortality Data

Ischemic heart diseases (I20–I25 according to the International Classification of Diseases, 10th revision (ICD-10)) represent about 17% of all deaths in Germany [22]. According to ICD-10, the following diseases are aggregated to IHD: Angina pectoris (I20), acute myocardial infarction (I21), subsequent myocardial infarction (I22), complications following acute myocardial infarction (I23), other acute ischemic heart diseases (I24), and chronic ischemic heart disease (I25). Daily mortality data are obtained from the Research Data Centre of the Statistical Offices of the Länder and cover all deaths in Germany due to ischemic heart diseases in the years 2001–2010, available at a resolution of 19 regions. Overall, the total number of IHD deaths in this period is about 1.5 million. In order to remove long-term trends and seasonal fluctuations, expected daily mortality is calculated by applying a 365-day Gaussian low-pass filter with a filter response function. Subsequently, the daily “excess” mortality, i.e., the difference between observed and expected mortality, is obtained. For more details regarding the mortality data and the applied standardization procedure, see [20].

2.2. Meteorological Data from Observations

Meteorological data for the period 2001–2010 were obtained from high-quality weather stations of the observational network of the German Meteorological Service. As we focused also on regional variations in the relationships between heat waves and mortality in the first part of the study, for every studied region a weather station was selected according to representativeness of the local climate and of the population under investigation. Altogether, a total of 19 weather stations were used to enable a representative nationwide coverage. For every station, daily mean air temperature was calculated from hourly temperature values at 2 m height. Data assimilation procedures were performed to fill in missing values and to ensure continuous temperature data series of high quality. A more extensive description of the station data set can be found in [20].

2.3. Climate Model Data

Temperature projections for the future climate are obtained from simulations of 19 regional climate models (RCMs). Fifteen out of 19 RCMs come from the ENSEMBLES multi model European project [23]. A detailed description of the ENSEMBLES project and further references can be found in [24]. Furthermore, four regional climate model simulations are obtained from the World Data Center for Climate (Hamburg, Germany) via the CERA WWW Gateway [25]. Table 1 gives information regarding the regional models, modeling groups, and global climate models (GCMs) which drive the RCMs.
Table 1. Regional climate models used for future temperature projections.
RCM AcronymModeling GroupDriving GCM
C4I_RCA3Community Climate Change Consortium for Ireland (C4I), IrelandHadCM3Q16
CNRM_RM5.1Centre National de Recherches Meteorologiques (CNRM), FranceARPEGE_RM5.1
DMI_HIRHAM5Danish Meteorological Institute (DMI), DenmarkARPEGE
DMI_HIRHAM5ECHAM5, run3
DMI_HIRHAM5BCM
ETHZ_CLM2.4.6Eidgenoessische Technische Hochschule Zuerich (ETHZ), SwitzerlandHadCM3Q0
ICTP_RegCM3International Centre for Theoretical Physics (ICTP), ItalyECHAM5, run3
KNMI_RACMO2Koninklijk Nederlands Meteorologisch Instituut (KNMI), NetherlandsECHAM5, run3
METEO-HC_HadRM3Q0Met Office Hadley Centre, United KingdomHadCM3Q0
METEO-HC_HadRM3Q3HadCM3Q3
METEO-HC_HadRM3Q16HadCM3Q16
MPI_REMO5.7Max Planck Institute (MPI), GermanyECHAM5, run3
SMHI_RCA3Swedish Meteorological and Hydrological Institute (SMHI), SwedenBCM
SMHI_RCA3ECHAM5, run3
SMHI_RCA3HadCM3Q3
MPI_REMO5.7Max Planck Institute (MPI), Germany, on behalf of the Federal Environment Agency, 2006, and the Federal Institute for Hydrology, 2009ECHAM5, run1
MPI_REMO5.8ECHAM5, run2
GKSS_CLM2.4.11Helmholtz Center Geesthacht, GermanyECHAM5, run1
GKSS_CLM2.4.11ECHAM5, run2
All RCM simulations are run under the IPCC greenhouse gas emission scenario A1B, based on the Special Report on Emission Scenarios (SRES, cf. [21]). The A1B scenario describes a world of rapid economic growth, a global population that reaches its maximum in mid-century, and a rapid introduction of new and more efficient technologies with a balance across fossil fuel and alternative sources. Regarding the CO2 concentrations, A1B represents a medium climate change scenario with a CO2 level increase from 367 ppm (year 2000) to 703 ppm by the year 2100.
The RCM simulations were originally run with a spatial resolution between 10 × 10 km2 and 25 × 25 km2. For evaluation purposes, we projected the data on a standardized grid for the Central European region with a resolution of 0.25° × 0.25°. Daily mean temperature data is analyzed for three time periods 1971–2000, 2021–2050, and 2069–2098, representing present, near future and remote future climate (the third time period 2069–2098 was chosen instead of 2071–2100 since part of the RCM data is already ending during the year 2099).

2.4. Heat Wave Definition and Metrics

A heat wave can be seen as “an extended period of unusually high atmosphere-related heat stress” [26]. Therefore, a heat wave always includes the combination of intensity and duration of high temperature periods. In our study, we apply a heat wave definition established by [20] to the climate model data. Heat waves are defined as periods of at least three consecutive days with daily mean air temperature above the 97.5th percentile of the temperature distribution in the period 1971–2000. This means that heat waves for future time periods are calculated using the temperature threshold of the present climate. All calculations were done separately for every grid point in order to enable the comparison of individual locations and regions.
For model validation, the present climate model results are compared with observational heat wave characteristics, which were obtained from weather station temperature data for the period 2001–2010 (cf. Section 2.2). Based on the applied heat wave definition, the following heat wave metrics are computed from the investigated 10 year (observations) and 30 year (model simulations) time periods:
-
HWN (heat wave number): the average number of heat waves per year
-
HWF (heat wave frequency): the average number of heat wave days per year
-
HWMD (heat wave mean duration): the average duration of heat waves per studied time period
-
HWLD (heat wave longest duration): the average duration of the longest heat wave per year (years without heat waves are excluded from this analysis)
-
HWI (heat wave intensity): the average temperature during heat waves per studied time period
-
HWA (heat wave amplitude): the average temperature of the hottest heat wave day per year (years without heat waves are excluded from this analysis)

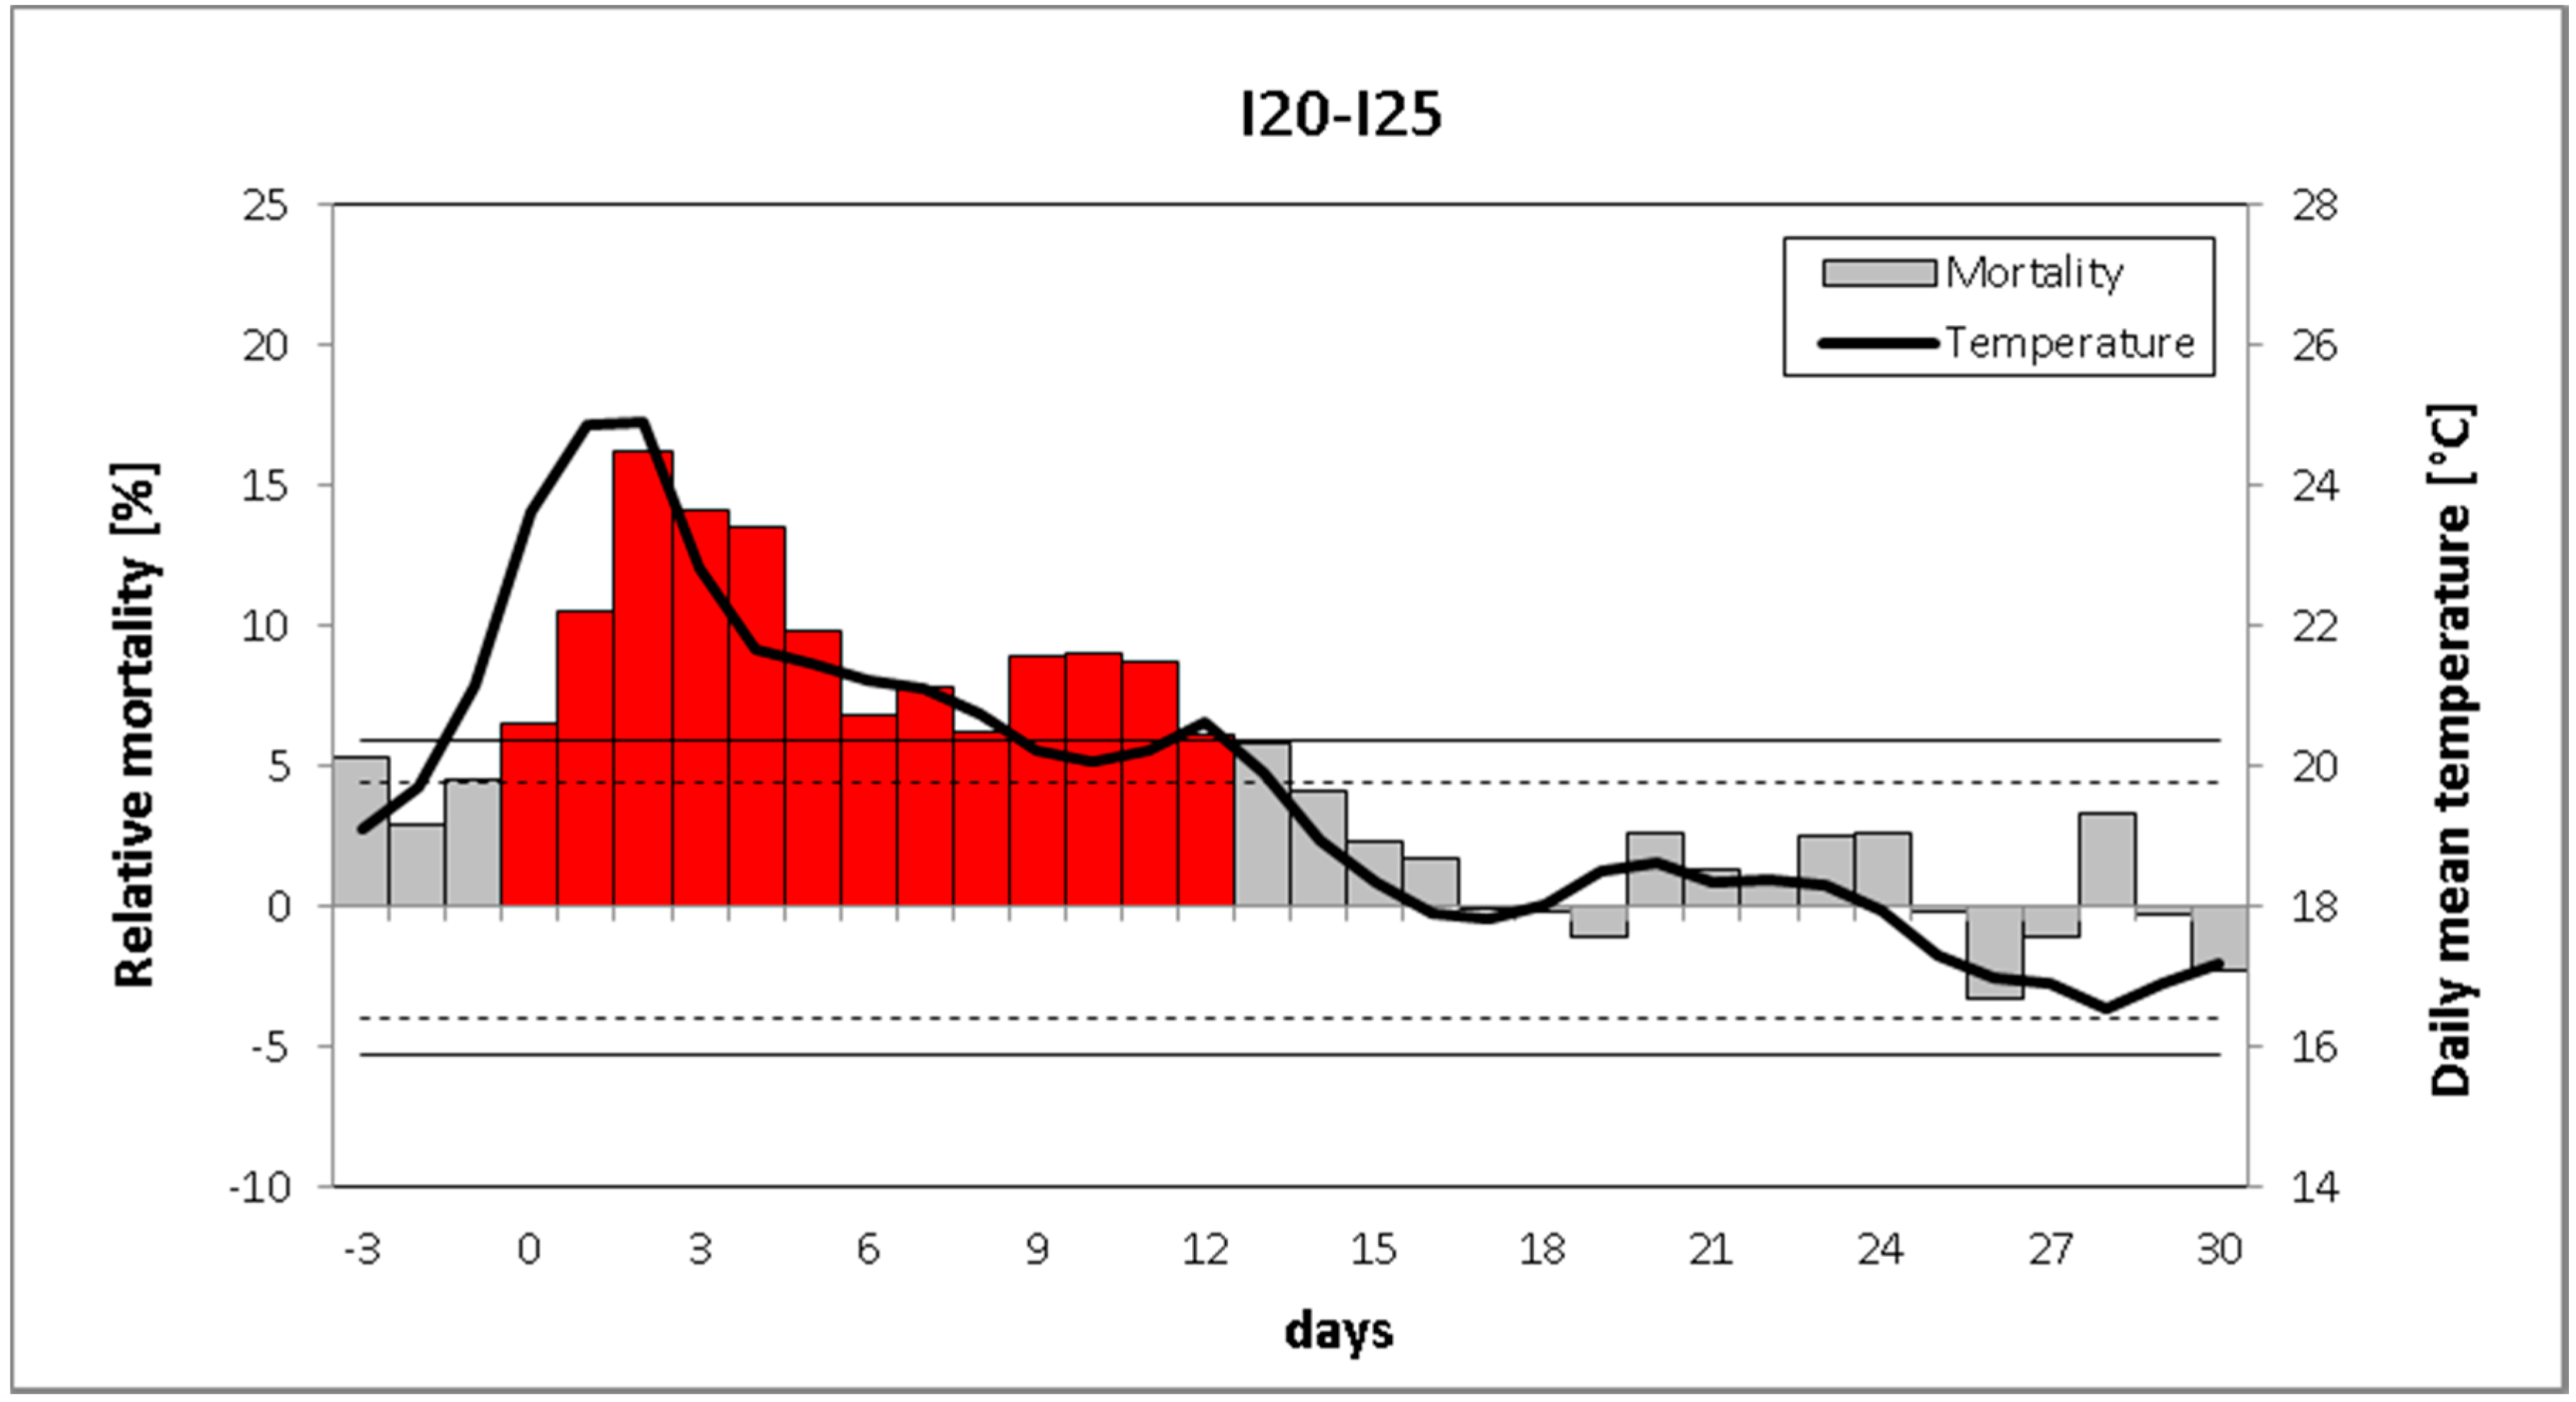
2.5. Calculation of Heat Wave-Related IHD Excess Deaths

In the first part of our study [20], the present-day heat wave-related IHD mortality risk was estimated from mortality and weather station data in 2001–2010 based on 19 regions in Germany. Daily excess mortality was calculated as the difference between observed and expected mortality (cf. Section 2.1). Subsequently, the heat wave-related IHD mortality risk (MR) was estimated as the average percentage deviation of daily excess mortality compared with daily expected mortality. In this second part of the study, we consider only the combined nationwide average of the obtained region-specific results, since pooling of information across regions improves the statistical power and generalizability of the results [27]. The aggregation of regional information was important in particular for the duration and intensity impacts, because for some regions there were too few heat waves in specific heat wave duration and intensity classes to compute reliable duration and intensity effects.
Based on the nationwide estimates, the expected number of IHD excess deaths (ED) at a heat wave day can be computed as:
ED = (MR/100) * N
where N represents the expected daily number of deaths on a non-heat wave day which was calculated from the mean daily IHD mortality across all summer (May-September) non-heat wave days in the period 2001–2010. In order to obtain the average annual IHD excess mortality due to heat waves for a given present-day or future time period, we compute the number of excess deaths for all heat wave days in the investigated period and divide the result by the number of years. Please note that for the projection of future excess mortality we assume the same rate of non-heat wave mortality N as in the present climate.
Since heat wave duration and intensity were shown to influence the heat wave impact on IHD mortality [20], we furthermore considered future changes in the characteristics of these parameters: while the duration effect is taken into account via applying the present-day mortality effects for heat waves of different lengths (3, 4, 5–9, ≥10 days), the intensity effect is included by using the observed temperature-mortality relationship for heat wave days.
The applied estimation of future heat wave-related IHD mortality is based on the presumption that there will be no acclimatization to heat in a future climate (AC0). However, people are expected to be able to adapt to a warmer climate at least to a certain degree. Therefore we additionally calculated future IHD mortality using a second approach assuming an acclimatization level of 50% (AC50), which was applied by [28] and is based on a shift in temperature thresholds. Instead of taking the temperature threshold of the present climate also for the future time periods as in the first approach, in this second method the future temperature threshold is determined by the arithmetic mean of the 97.5th percentiles of the daily mean temperature distributions obtained from present and respective future climate.

3. Results

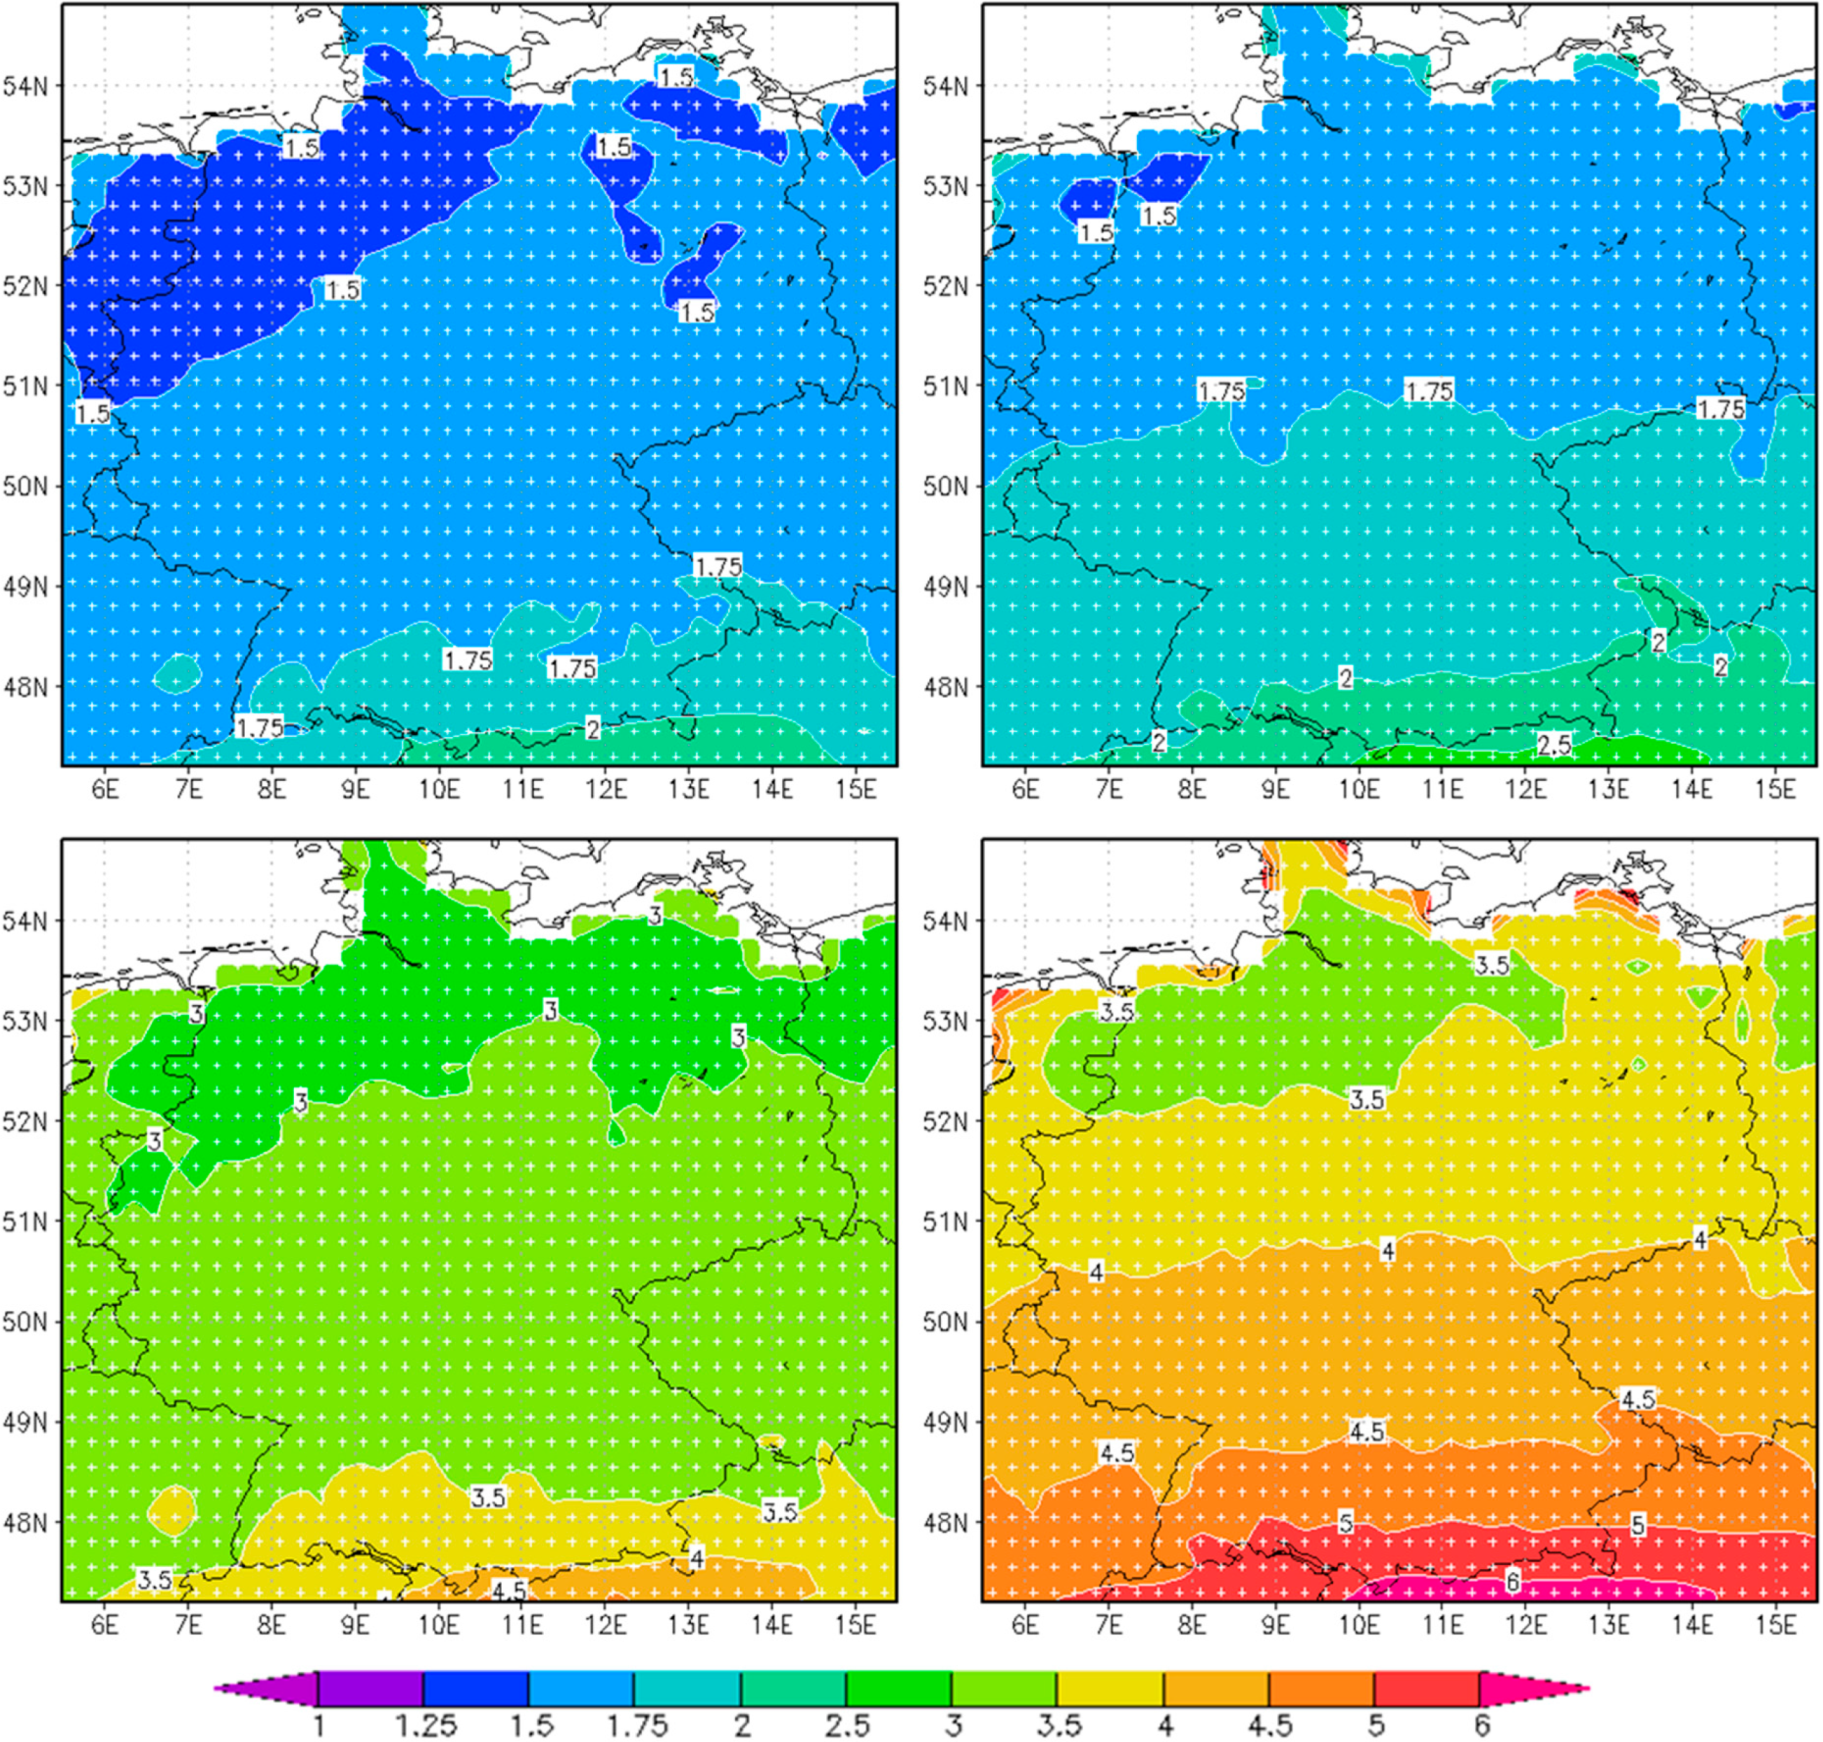
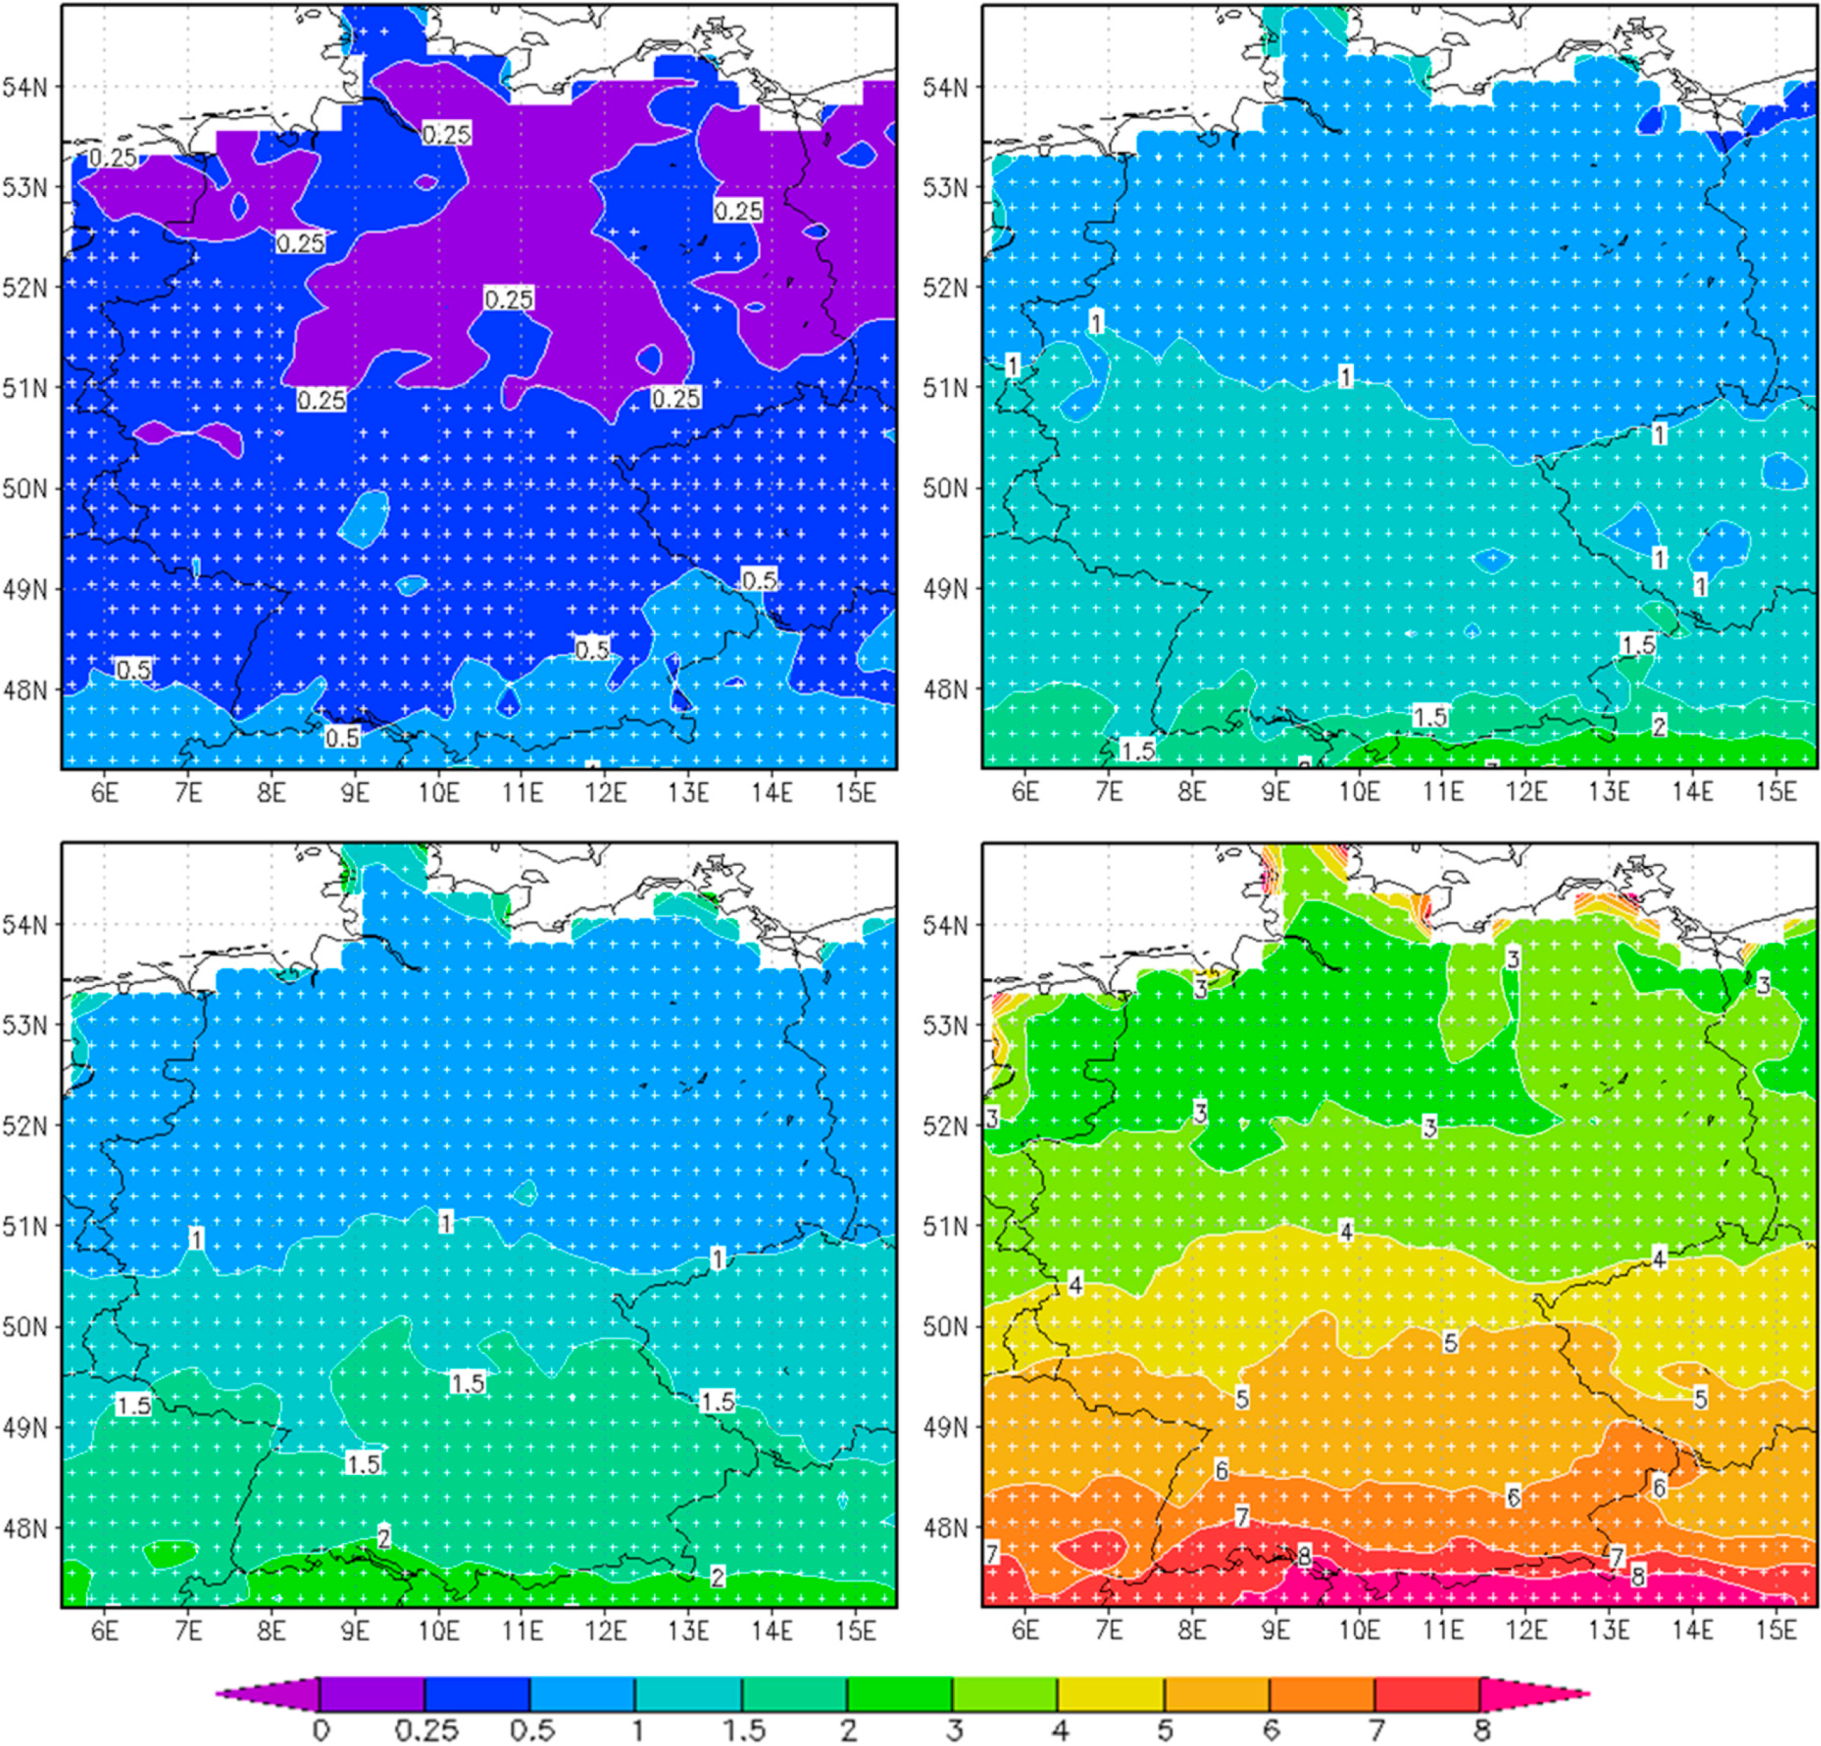
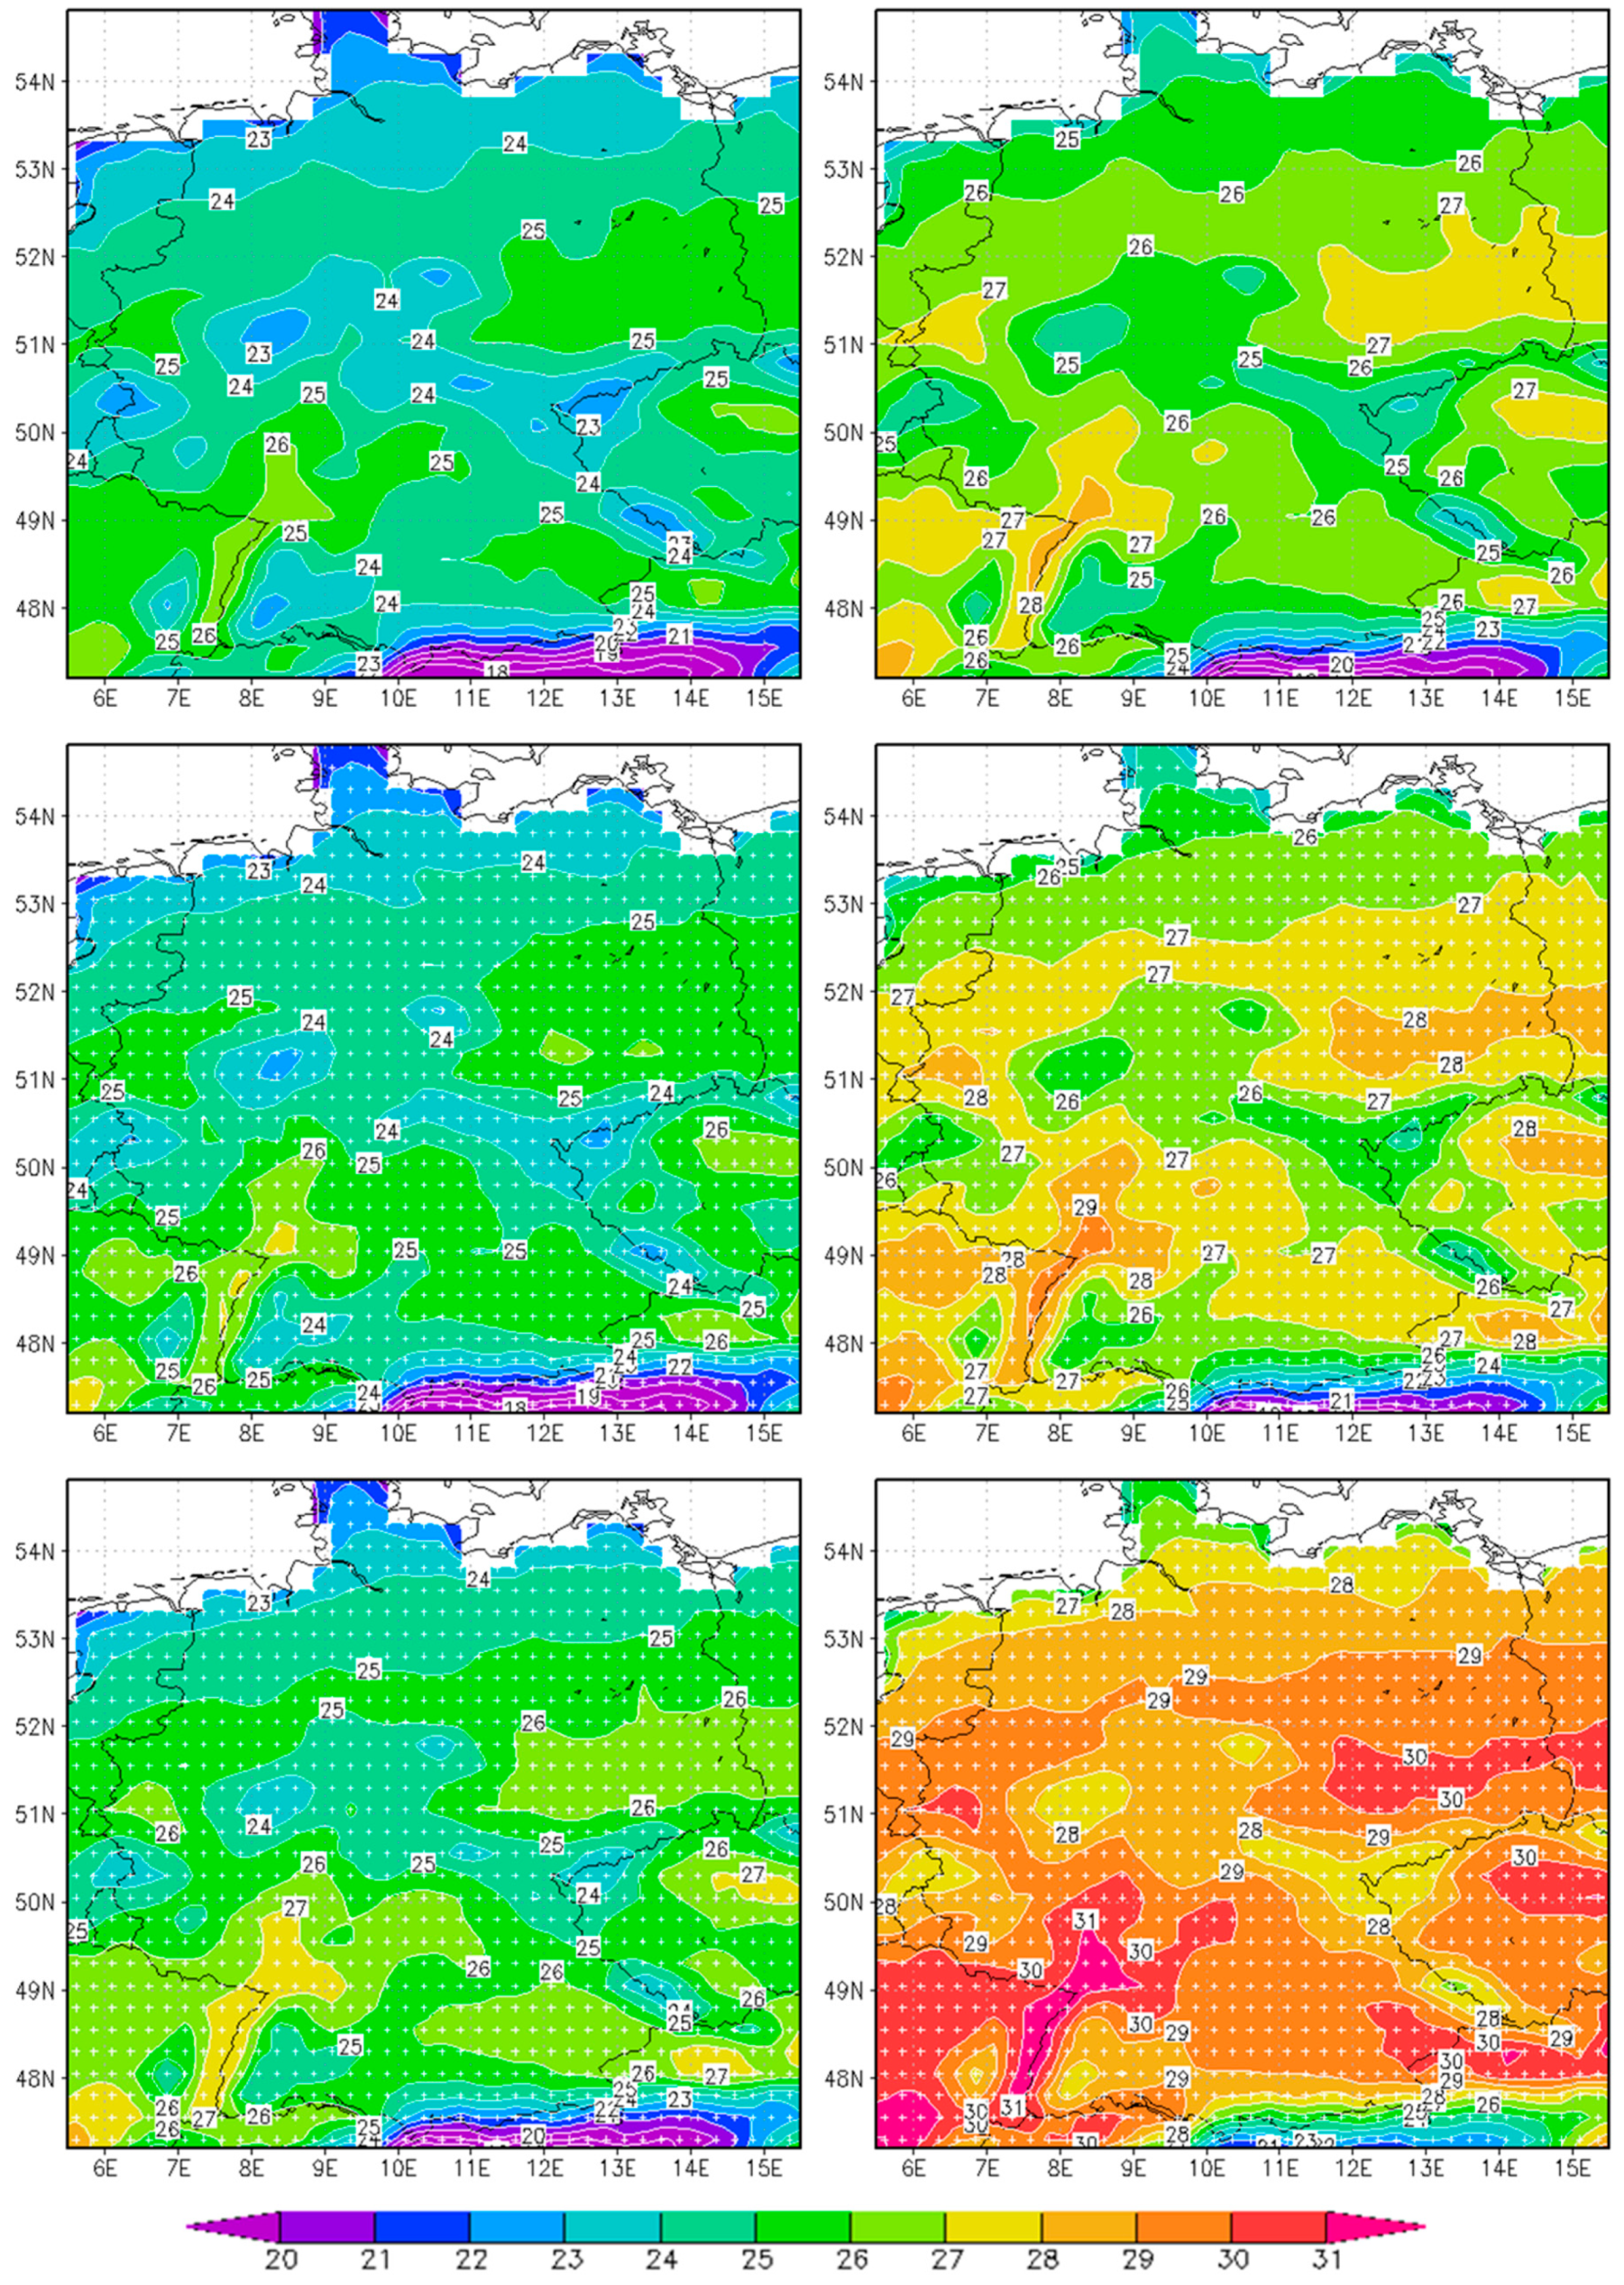
3.1. Future Heat Wave Characteristics

Present-day and future heat wave characteristics based on observations and regional model simulations are presented in Table 2. The comparison between model results and observations regarding the present climate exhibits only minor differences. For all heat wave metrics, the observations show comparable values to the ensemble mean of the 19 model simulations, which provides confidence in the ability of the models to simulate also future heat wave statistics in a reliable way. The spatial patterns of heat wave characteristics derived from the model data are displayed in Figure 1, Figure 2 and Figure 3. Please note that due to the heat wave definition based on local thresholds there is only minor present-day regional variability in the number, frequency, and duration of heat waves. Therefore, we did not include maps for the present climate period 1971–2000 in Figure 1 and Figure 2.
The ensemble mean annual number of heat waves (HWN) is expected to increase strongly from 1.2 in 1971–2000 to 1.9 in 2021–2050 and 3.8 in 2069–2098 (Table 2). This means that the average number of heat waves will be tripled by the end of the 21st century compared to present climate. If we look at the ensemble mean frequency of heat wave days (HWF), the expected climate change is even higher with an increase from about 6 days per year to 23 days per year between 1971–2000 and 2069–2098, which represents a factor of about 4. The spatial distribution of future changes of HWN and HWF shows that the number of heat waves and heat wave days will increase stronger in the South than in the North of Germany (Figure 1). For example, the expected annual number of heat wave days will increase by factor 3.5 in the North German Plain and by more than factor 5 near the Alps in the period 2069–2098 compared to the present climate.
Table 2. Heat wave metrics averaged over Germany from observations (OBS, 2001–2010) and 19 regional model simulations for 1971–2000, 2021–2050, and 2069–2098. The last two columns specify the climate change (CC) signals for near and remote future climate (2021–2050 and 2069–2098, respectively, compared to 1971–2000). Regarding the simulations, for each period the ensemble mean (first number) as well as the minimum and the maximum ensemble member (in parentheses) are listed.
OBSRCMsRCMsRCMsCC Signal Near FutureCC Signal Remote Future
(2001–2010)(1971–2000)(2021–2050)(2069–2098)
HWN1.11.21.93.80.72.6
(number)(1.0/1.3)(1.3/2.5)(1.7/5.2)(0.0/1.3)(0.4/4.1)
HWF5.45.710.123.34.417.6
(number)(4.6/7.6)(5.9/14.9)(8.2/38.9)(0.2/9.3)(1.7/33.6)
HWMD5.04.95.26.10.31.2
(days)(4.1/6.7)(4.2/6.2)(4.8/7.8)(-0.5/1.3)(-0.5/3.0)
HWLD5.65.76.710.11.04.4
(days)(4.7/8.4)(4.7/9.0)(5.9/16.4)(-0.8/3.1)(0.0/10.5)
HWI24.724.224.525.10.30.9
(°C)(20.9/30.3)(21.0/31.2)(21.7/31.1)(0.1/1.0)(0.3/1.7)
HWA26.025.926.728.80.82.9
(°C)(22.2/33.0)(22.7/34.8)(24.2/35.7)(0.1/2.5)(1.0/5.2)
Simulated heat waves are also expected to last longer in the future. According to the model simulations, the ensemble mean duration of heat waves (HWMD) will increase from 4.9 days in 1971–2000 to 5.2 days in 2021–2050 and 6.1 days in 2069–2098 (Table 2). If only the longest heat wave per summer is considered (HWLD), the simulated changes are much higher with an ensemble mean increase from 5.7 days in 1971–2000 to 6.7 days in 2021–2050 and 10.1 days in 2069–2098, which means that the duration of the longest heat wave per summer will approximately be doubled by the end of the 21st century. Again, the climate change effects are strongest in the southern regions of Germany (Figure 2). The regional differences are most pronounced for HWLD and the period 2069–2098, where the longest heat wave per summer will presumably extend by 3 days in the North and by up to 7 days in the South.
The model simulations show additionally that future heat waves will become more intense. The ensemble mean heat wave intensity (HWI) will rise slightly from 24.2 °C in 1971–2000 to 24.5 °C in 2021–2050 and 25.1 °C in 2069–2098 (Table 2). Moreover, the ensemble mean heat wave amplitude (HWA) is projected to increase considerably from 25.9 °C in 1971–2000 to 26.7 °C in 2021–2050 and 28.8 °C in 2069–2098. The spatial patterns of heat wave intensity and amplitude for present and future climate are displayed in Figure 3. Generally, the highest temperature values are found at the valleys of the rivers of Rhine and Danube in Southern Germany and in some regions in the East. In the future, the average heat wave intensity and amplitude will increase particularly in Southern Germany, which leads to an intensified heat burden in this region. Specifically, the Upper Rhine valley will experience extremely high HWA values of more than 31 °C daily mean temperature at the end of the 21st century.
Figure 1. Projected ensemble mean of the annual number of heat waves (left) and heat wave days (right) for 2021–2050 (top) and 2069–2098 (bottom), expressed as ratio between scenario period and control period 1971–2000. Grid points with significant changes (α < 0.05) between present and future climate are marked by white crosses.
Climate 03 00100 g001
The heat wave characteristics feature a considerable range of uncertainty due to model variability. The differences between the maximum and minimum ensemble members are enhanced particularly for the future climate. However, the climate change signals are positive for almost all RCM simulations and heat wave metrics. In particular, for the number of heat waves and heat wave days as well as for heat wave intensity and amplitude, every single RCM shows an increase for both future climate periods. If we look at the heat wave duration metrics, positive climate change signals are observed for the majority of model simulations (at least 16 out of 19 RCMs).
Figure 2. Projected ensemble mean changes of the average duration of heat waves (left) and the longest duration of heat waves per summer (right) for 2021–2050 (top) and 2069–2098 (bottom), expressed as difference in days with respect to the control period 1971–2000. Grid points with significant changes (α < 0.05) between present and future climate are marked by white crosses.
Climate 03 00100 g002
The statistical significance (α < 0.05) of the differences between present and future climate is tested for all grid points separately using a student t-test (based on annual means and all RCM ensemble members together). The observed changes in heat wave statistics are significant for most heat wave metrics and regions in Germany. Heat wave number, frequency, longest duration, intensity, and amplitude feature a significant positive climate change signal for all grid points in Germany and both future time periods. Regarding the mean duration of heat waves, in 2021–2050 significant changes are observed solely in the southern parts of Germany. However, in 2069–2098 all grid points show significant differences between present and future climate also for this characteristic.
Figure 3. Projected ensemble mean of the average heat wave intensity (left) and amplitude (right) in degrees Celsius for 1971–2000 (top), 2021–2050 (center) and 2069–2098 (bottom). Grid points with significant changes (α < 0.05) between present and future climate are marked by white crosses.
Climate 03 00100 g003

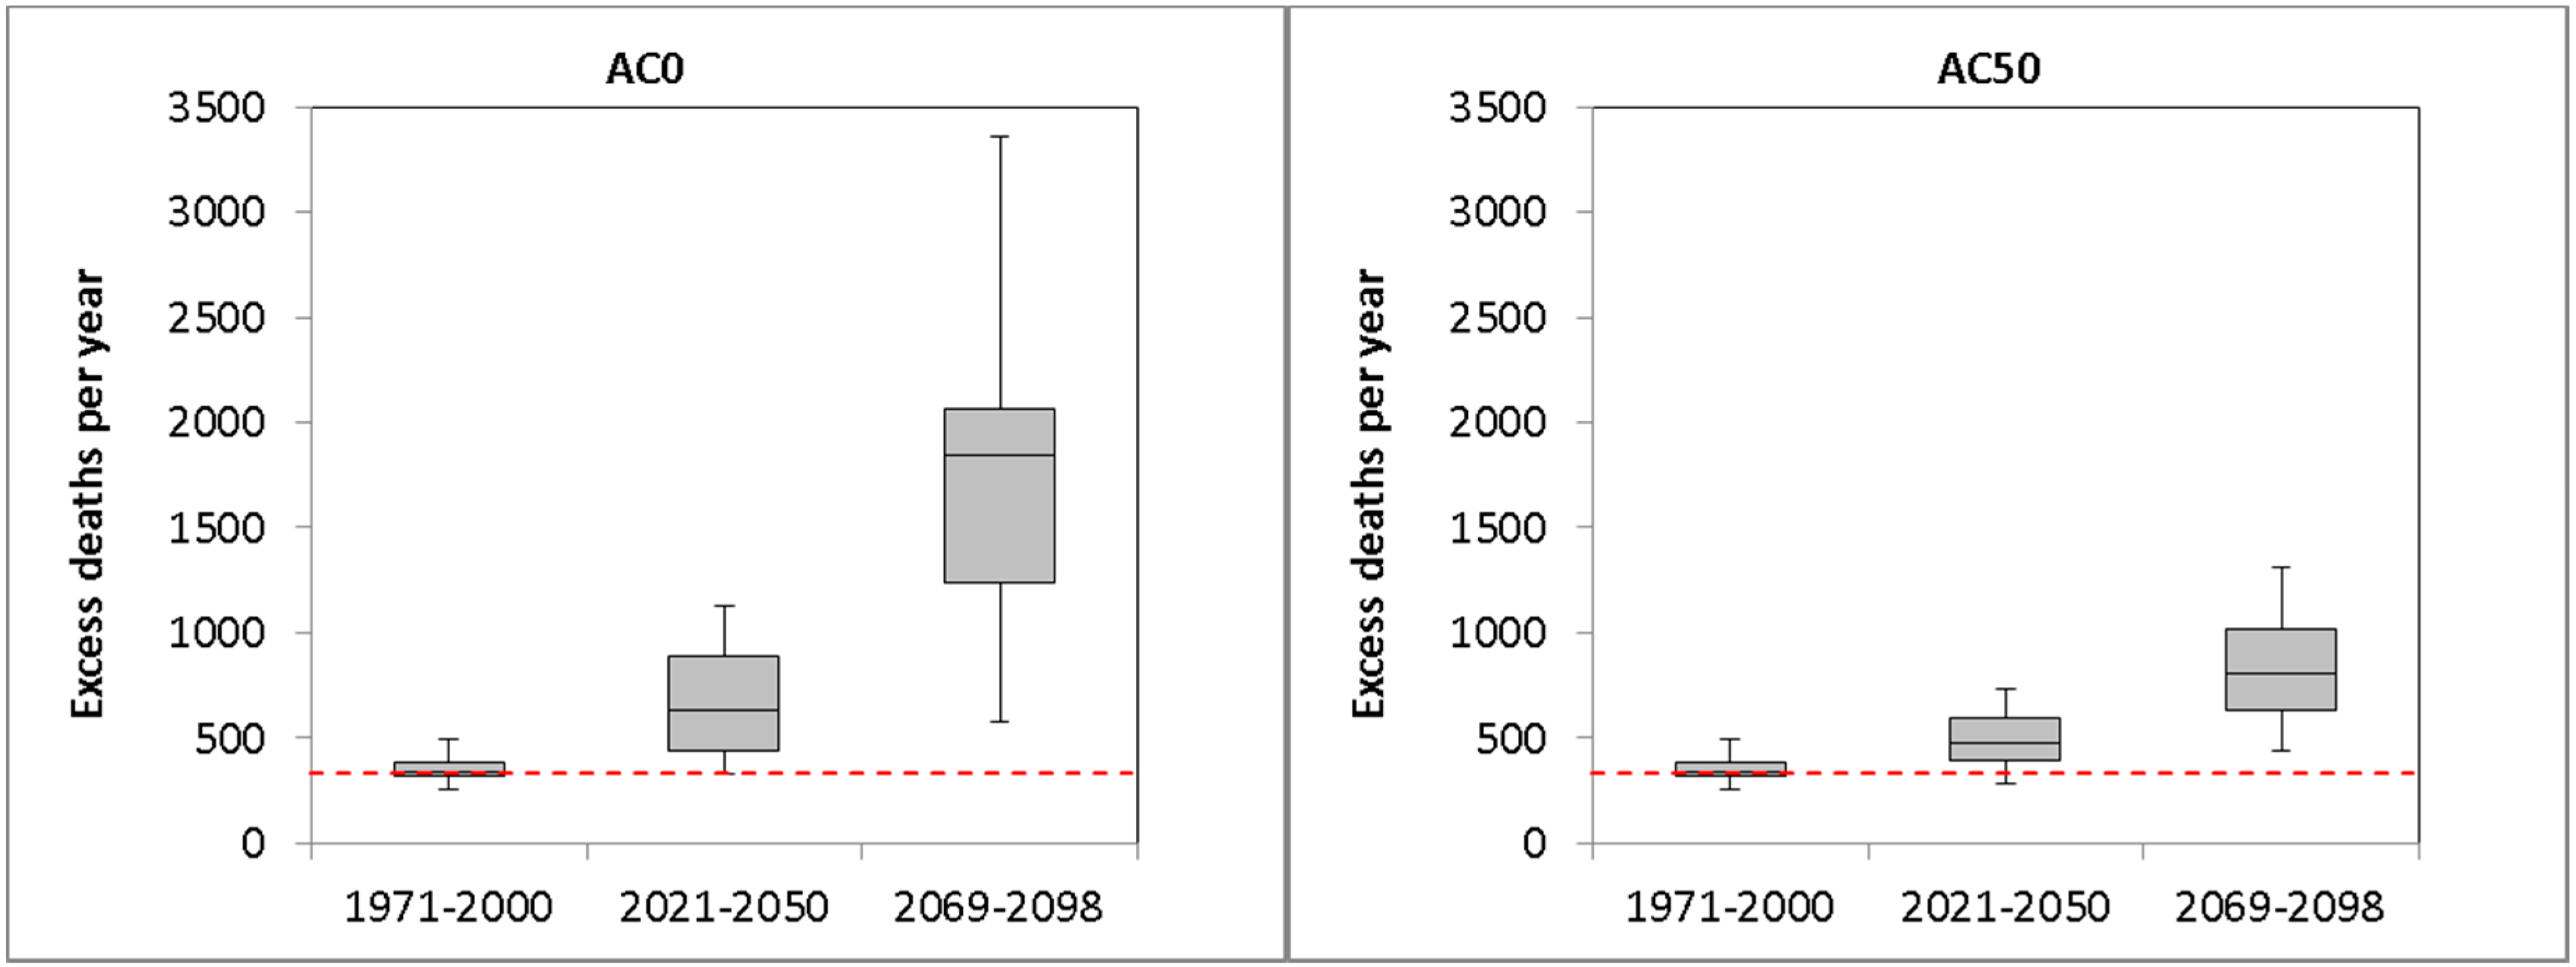
3.2. Future Heat Wave-Associated IHD Mortality

The present-day heat wave impacts on IHD deaths in Germany were calculated in the first part of our study [20]. The mean temporal course of mortality during heat waves documents the strong relationship between heat and IHD excess deaths (cf. Figure 4, which was taken from [20], their Figure 2). For the time period of 2001–2010, there were on average 403 IHD deaths on a summer (May–September) non-heat wave day. Using standardized mortality data adjusted for long-term trends and seasonal fluctuations, the overall IHD mortality during heat wave days was shown to be increased significantly by 15.2%.
Figure 4. Mean relative deviations of IHD mortality in 2001–2010 for 34-day sequences of heat waves beginning from three days before up to 30 days after the onset of the heat waves ([20]). Solid (dashed) lines denote the 99% (95%) confidence interval obtained by the Monte Carlo method, highly significant relative deviations (α < 0.01) are colored in red.
Climate 03 00100 g004
This relative risk adds up to an average number of 331 IHD excess deaths per year in Germany attributable to heat waves. Furthermore, heat wave duration and intensity effects were detected [20]. Firstly, the duration of heat waves was shown to have major impacts on the daily IHD mortality effects (3 days: 10.1%, 4 days: 15.1%, 5–9 days: 17.2%, 10 days and above: 19.9%). Secondly, heat wave days with high daily mean temperature feature stronger mortality impacts than heat wave days with moderate temperatures. The average temperature-mortality relationship among all heat wave days shows a 2.8% IHD mortality increase per degree Celsius increase of daily mean temperature.
Heat wave-associated IHD mortality in Germany from regional model simulations is estimated based on observed heat wave-mortality relationships and simulated heat wave statistics for present and future climate. The ensemble mean of the heat wave-attributed IHD mortality in Germany is 352 deaths per year for the present climate time period 1971–2000 (Table 3), which is in line with the annual number of 331 IHD excess deaths calculated from observations. Assuming no acclimatization to heat in a future climate (AC0), heat wave-related IHD mortality in Germany is expected to rise substantially. The ensemble mean IHD excess mortality increases to 685 deaths per year in 2021–2050 and to 1801 deaths per year in 2069–2098 (Table 3, upper row). This means that future IHD excess mortality would be enhanced by a factor of 1.9 and 5.1, respectively. If an acclimatization level of 50% is assumed (AC50), IHD mortality is expected to experience a slower but still significant rise. The ensemble mean IHD excess mortality is projected to be 494 deaths per year in 2021–2050 and 835 deaths per year in 2069–2098 (Table 3, lower row), which represents a factor of 1.4 and 2.4, respectively.
Table 3. Heat wave-related IHD excess deaths per year in Germany from observations (OBS, 2001–2010) and 19 regional model simulations for 1971–2000, 2021–2050, and 2069–2098 according to two acclimatization approaches: AC0 (upper row) and AC50 (lower row). The last two columns specify the climate change (CC) signals for near and remote future climate (2021–2050 and 2069–2098, respectively, compared to 1971–2000). Regarding the simulations, for each period the ensemble mean (first number) as well as the minimum and the maximum ensemble member (in parentheses) are listed.
OBSRCMsRCMsRCMsCC Signal Near FutureCC Signal Remote Future
(2001–2010)(1971–2000)(2021–2050)(2069–2098)
AC033135268518013331449
(251/496)(324/1132)(572/3362)(36/760)(160/3024)
AC50331352494835142483
(251/496)(281/730)(440/1313)(−15/351)(28/970)
Figure 5. Projected IHD excess deaths per year in Germany attributable to heat waves from 19 regional model simulations for 1971–2000, 2021–2050, and 2069–2098 according to two acclimatization approaches: AC0 (left) and AC50 (right). The red dotted line denotes the annual number of IHD excess deaths assessed from observations (OBS) based on mortality and weather station data for the period 2001–2010. The box plots depict the distribution of the RCM simulation results: the bottom and top of the boxes denote the first and the third quartile, the band inside the box is the median, and the ends of the whiskers represent the minimum and maximum of the ensemble members.
Climate 03 00100 g005
The observed changes in IHD mortality are significant (α < 0.05) for both methods and future time periods (using a student t-test based on annual means and all RCM ensemble members together). The range of future IHD mortality projections exhibits substantial differences between the individual model simulations (Figure 5) with particularly high uncertainties for the non-acclimatization approach (AC0) and the remote future period 2069–2098. Despite the large range of uncertainty among the IHD mortality projections, virtually all RCMs feature a positive climate change signal which indicates that heat wave-related IHD mortality in Germany will most likely increase considerably in the future.

4. Discussion and Conclusions

Regional model simulations were evaluated to estimate the influence of climate change on heat waves in Germany. A set of six heat wave metrics was computed in order to enable a comprehensive analysis of heat wave characteristics. The simulations indicate that climate change will have significant impacts on the occurrence of heat waves in Germany. On average, the annual number of heat waves (HWN) is expected to rise by factor 1.6 and 3.2 in 2021–2050 and 2069–2098, respectively, accompanied by increases in heat wave duration and intensity. Heat wave metrics characterizing very rare extreme events, as the longest heat wave or hottest heat wave day per year will experience even stronger climate change effects. The achieved findings are consistent with the results of other studies, which also project more, longer and hotter future heat waves for different parts of the world, e.g., North America [15], Europe [29], and Australia [30].
In addition, we detected distinct regional differences regarding the future occurrence of heat waves. For all heat wave metrics, the largest climate change signals are observed in the southern parts of Germany. By the end of the 21st century, the annual number of heat wave days is projected to be enhanced by a factor of 3.5 in the North and by a factor of 5 in the South. This is in line with results from other studies [29,31], which also found higher future heat wave frequencies in the southern parts of Central Europe. The projected spatial patterns of future heat wave characteristics indicate an enhanced heat burden particularly for people living in some regions of Southern Germany, e.g., the Upper Rhine valley.
Based on the simulated changes in heat wave statistics and on present-day heat wave-mortality relationships obtained by a previous study [20], we analyzed the influence of climate change on heat wave-related IHD mortality in Germany. The results indicate that by the end of the 21st century the future IHD excess mortality will be enhanced significantly by factor 2.4 in the 50% acclimatization approach and by factor 5.1 in the non-acclimatization projection. The simulated mortality trends are confirmed by recent studies, which also project large increases in future heat-related mortality [18,28,32,33,34].
The estimation of future heat wave characteristics and heat wave-related mortality relies strongly on the choice of numerical models. In our work, we used an ensemble of 19 regional simulations with high spatial resolution in order to specify a range of potential future heat wave projections. The obtained results feature substantial variability in future IHD mortality among the individual model simulations. For instance, heat wave-related IHD mortality is projected to increase till the end of the 21st century by factor 1.4–10.0 in the non-acclimatization approach (with an ensemble mean factor of 5.1). The large intermodel variations are confirmed by previous studies [17,35] that identified the choice of climate models as the primary source of uncertainty in the estimation of future heat-related mortality. Furthermore, the observed results highlight the main advantage of the ensemble approach, namely to avoid the risk of accidentally choosing a model with results lying at the outer boundary of potential future projections. In our study, the present-day ensemble mean number of heat wave-related IHD deaths fits the observed IHD excess mortality fairly well, which indicates that the ensemble mean of future time periods can likely be regarded as a more reliable estimate of future IHD mortality as the minimum or maximum of the ensemble members.
In addition to changes in heat wave frequency, also higher temperatures and longer durations of heat waves may contribute to an increased heat burden in the future. In contrast to previous studies that did not account for the intensity and duration effect [17,18], we included these criteria in the estimation of future heat wave mortality. Under the applied heat wave definition, the incorporation of the intensity and duration effect increased the projected future IHD excess mortality in Germany by about 25%–35% compared to a mortality estimation based on heat wave frequencies alone. Therefore, we recommend that future studies should consider this additional source of uncertainty in heat wave-related mortality projections.
Present-day heat-health relationships are unlikely to remain constant in the future, since people will (at least partially) adapt to warming temperatures by gradual physiological acclimatization. We calculated future IHD mortality with and without acclimatization in order to specify a range of potential mortality estimates. While the non-acclimatization approach gives an upper limit of future mortality projections, the acclimatization approach represents conditions where people will have adapted considerably to a warmer world. Our acclimatization approach reduced the future non-acclimatization increases in heat wave-related IHD mortality by more than 50%. This is a rather optimistic assumption compared to previous studies that project smaller potential acclimatization effects (e.g., [36] calculated a 25% reduction of future heat-related mortality increases due to acclimatization based on an “analog city” approach). However, estimating the degree of future acclimatization to heat is a complex issue and to date there is no standard approach to model the acclimatization effect [37].
Future mortality projections estimated in our study rely on several assumptions and limitations. Firstly, all investigated model simulations are based on a single emission scenario, the IPCC scenario A1B. Although this scenario represents a moderate climate change projection, higher or lower increases of CO2 concentration and temperature in the future would probably cause a faster or slower rise of heat wave-related IHD mortality as in the applied scenario. However, we did not investigate multiple emission scenarios and concentrated on the combination of scenario A1B with various model simulations, since studies report that future excess mortality is sensitive mainly to the choice of climate models and to a lesser extent to the choice of scenarios [17]. Secondly, in our work we focused on the heat wave definition by [20] that has proven to be suitable to capture the relationship between heat waves and IHD mortality adequately. Nevertheless, the use of different heat wave definitions (based on different thermal indices, temperature thresholds, and minimum durations) could additionally exert an influence on heat wave mortality projections [18]. Furthermore, we assumed that the baseline rate of IHD mortality on non-heat wave days will remain constant in the future, a presumption which could emerge as erroneous due to improvements in medical knowledge and care quality. Additionally, due to the lack of appropriate data, we could not consider potential changes in population size and age structure which can also play an important role in assessing the future burden of heat [38].
Also, it is important to note that in our study we focused on heat wave-related mortality which represents solely a part of the overall range of temperature-related mortality. Mid-latitude countries typically show a seasonal pattern with a mortality peak in winter [39] and most studies project a reduction of cold-related mortality due to global warming (e.g., [40]), which acts in the opposite direction as the expected increase in future heat-related mortality. Furthermore, some authors also detected an influence of previous winter mortality on summer heat-related mortality [41].
In conclusion, the presented results show that (a) the frequency, duration, and intensity of heat waves in Germany are projected to increase significantly in the future, which in turn (b) will most likely multiply future heat wave-related IHD mortality even in the presence of a considerable degree of acclimatization. The strengths of the current study consist in the use of a multitude of high-resolution regional climate models, the incorporation of heat wave intensity and duration effects, and the implementation of an approach to model the acclimatization effect. Furthermore, we studied heat-related cause-specific mortality in a nationwide analysis for Germany, which has been rarely investigated to date. The obtained results point to preventive measures in order to lessen the future heat burden. For example, there is evidence that the implementation of heat health warning systems and heat wave action plans is able to decrease the heat wave impact on mortality [42,43]. Furthermore, other public adaptation strategies, an enhanced use of air conditioning, and individual behavioral adaptation could help to reduce the future number of heat wave-attributed deaths.

Acknowledgments

This work was funded by the Federal Environment Agency and the Federal Ministry for the Environment, Nature Conservation, Building, and Nuclear Safety as part of the project UFOPLAN-371161238 “Climate change, bioclimatology and health effects” (2012–2014), embedded in the German Adaptation Strategy to climate change. The ENSEMBLES data used in this work was funded by the EU FP6 Integrated Project ENSEMBLES (Contract number 505539) whose support is gratefully acknowledged. We would like to kindly thank the World Data Center for Climate (Hamburg, Germany) for providing additional climate model data (MPI_REMO5.7, MPI_REMO5.8, GKSS_CLM2.4.11, and GKSS_CLM2.4.11). We are also thankful to Deutsches Klimarechenzentrum (Hamburg, Germany) for computer capacity and to Urban Janisch (Research Data Centre of the Statistical Office of the Länder) for his help regarding the mortality and morbidity data. We would also like to thank two anonymous reviewers for their helpful comments.

Author Contributions

All authors contributed extensively to the work presented in this paper. Hans-Guido Mücke supervised the project, Christina Koppe assembled the mortality data, and Stefan Zacharias performed the analysis of the climate model data. Stefan Zacharias wrote the main paper, and Christina Koppe and Hans-Guido Mücke wrote parts of the manuscript. All authors discussed the results and implications and commented on the manuscript at all stages.

Conflicts of Interest

The authors declare no conflict of interest.

References

  1. Basu, R. High ambient temperature and mortality: A review of epidemiologic studies from 2001 to 2008. Environ. Health 2009, 8. [Google Scholar] [CrossRef]
  2. Ostro, B.; Rauch, S.; Green, R.; Malig, B.; Basu, R. The effects of temperature and use of air conditioning on hospitalizations. Am. J. Epidemiol. 2010, 172, 1053–1061. [Google Scholar] [CrossRef] [PubMed]
  3. Luber, G.; McGeehin, M. Climate change and extreme heat events. Am. J. Prev. Med. 2008, 35, 429–435. [Google Scholar] [CrossRef] [PubMed]
  4. Larsen, J. Setting the Record Straight: More than 52,000 Europeans Died from Heat in Summer 2003. Available online: http://www.earth-policy.org/plan_b_updates/2006/update56 (assessed on 6 October 2014).
  5. Gosling, S.N.; Lowe, J.A.; McGregor, G.R.; Pelling, M.; Malamud, B.D. Associations between elevated atmospheric temperature and human mortality: A critical review of the literature. Clim. Chang. 2009, 92, 299–341. [Google Scholar] [CrossRef]
  6. Baccini, M.; Biggeri, A.; Accetta, G.; Kosatsky, T.; Katsouyanni, K.; Analitis, A.; Anderson, H.R.; Bisanti, L.; D’Ippoliti, D.; Danova, J.; et al. Heat effects on mortality in 15 European cities. Epidemiology 2008, 19, 711–719. [Google Scholar] [CrossRef]
  7. Kyselý, J.; Plavcová, E.; Davídkovová, H.; Kynčl, J. Comparison of hot and cold spell effects on cardiovascular mortality in individual population groups in the Czech Republic. Clim. Res. 2011, 49, 113–129. [Google Scholar] [CrossRef]
  8. Kovats, R.S.; Hajat, S. Heat stress and public health: a critical review. Annu. Rev. Public Health 2008, 29, 41–55. [Google Scholar] [CrossRef] [PubMed]
  9. Anderson, G.B.; Bell, M.L. Heat waves in the United States: Mortality risk during heat waves and effect modification by heat wave characteristics in 43 US communities. Environ. Health Perspect. 2011, 119, 210–218. [Google Scholar] [CrossRef] [PubMed]
  10. Hajat, S.; Armstrong, B.; Baccini, M.; Biggeri, A.; Bisanti, L.; Russo, A.; Paldy, A.; Menne, B.; Kosatsky, T. Impact of high temperatures on mortality: Is there an added heat wave effect? Epidemiology 2006, 17, 632–638. [Google Scholar] [CrossRef] [PubMed]
  11. Cheng, X.; Su, H. Effects of climatic temperature stress on cardiovascular diseases. Eur. J. Intern. Med. 2010, 21, 164–167. [Google Scholar] [CrossRef] [PubMed]
  12. Nawrot, T.S.; Staessen, J.A.; Fagard, R.H.; van Bortel, L.M.; Struijker-Boudier, H.A. Endothelial function and outdoor temperature. Eur. J. Epidemiol. 2005, 20, 407–410. [Google Scholar] [CrossRef] [PubMed]
  13. Havenith, G. Temperature regulation, heat balance and climatic stress. In Extreme Weather Events and Public Health Responses; Springer-Berlin: Heidelberg, Germany, 2005; pp. 69–80. [Google Scholar]
  14. Shapiro, Y.; Moran, D.; Epstein, Y. Acclimatization strategies—Preparing for exercise in the heat. Int. J. Sports Med. 1998, 19, 161–163. [Google Scholar] [CrossRef]
  15. Meehl, G.A.; Tebaldi, C. More intense, more frequent, and longer lasting heat waves in the 21st century. Science 2004, 305, 994–997. [Google Scholar] [CrossRef] [PubMed]
  16. Huang, C.; Barnett, A.G.; Wang, X.; Vaneckova, P.; FitzGerald, G.; Tong, S. Projecting future heat-related mortality under climate change scenarios: A systematic review. Environ. Health Perspect. 2011, 119, 1681–1690. [Google Scholar] [CrossRef] [PubMed] [Green Version]
  17. Peng, R.D.; Tebaldi, C.; McDaniel, L.; Bobb, J.; Dominici, F.; Bell, M.D. Toward a quantitative estimate of future heat wave mortality under global climate change. Environ. Health Perspect. 2011, 119, 701–706. [Google Scholar] [CrossRef] [PubMed]
  18. Wu, J.; Zhou, Y.; Gao, Y.; Fu, J.S.; Johnson, B.A.; Huang, C.; Kim, Y.-M.; Liu, Y. Estimation and uncertainty analysis of impacts of future heat waves on mortality in the eastern United States. Environ. Health Perspect. 2014, 122, 10–16. [Google Scholar] [CrossRef] [PubMed]
  19. Bittner, M.I. Effects of heat waves on mortality in Germany. Gesundheitswesen 2013. [Google Scholar] [CrossRef]
  20. Zacharias, S.; Koppe, C.; Mücke, H.-G. Influence of heat waves on ischemic heart diseases in Germany. Climate 2014, 2, 133–152. [Google Scholar] [CrossRef]
  21. Nakicenovic, N.; Alcamo, J.; Davis, G.; de Vries, B.; Fenhann, J.; Gaffin, S.; Gregory, K.; Gruebler, A.; Jung, T.Y.; Kram, T. Special Report on Emissions Scenarios, Working Group III, Intergovernmental Panel on Climate Change (IPCC); Cambridge University Press: Cambridge, UK, 2000. [Google Scholar]
  22. Federal Statistical Office of Germany. Gesundheit: Todesursachen in Deutschland 2010; Statistisches Bundesamt: Wiesbaden, Germany, 2011. [Google Scholar]
  23. ENSEMBLES Data Base. Available online: http://www.ensembles-eu.org/ (assessed on 15 October 2014).
  24. Hewitt, C.D. The ENSEMBLES Project: Providing ensemble-based predictions of climate changes and their impacts. EGGS Newsl. 2005, 13, 22–25. [Google Scholar]
  25. CERA Data Base. Available online: http://cera-www.dkrz.de/CERA/index.html (assessed on 26 October 2014).
  26. Robinson, P.J. On the definition of a heat wave. J. Appl. Meteorol. 2001, 40, 762–775. [Google Scholar] [CrossRef]
  27. Dominici, F. Invited Commentary: Air pollution and health—What can we learn from a hierarchical approach? Am. J. Epidemiol. 2002, 155, 11–15. [Google Scholar] [CrossRef] [PubMed]
  28. Hales, S.; Kovats, S.; Lloyd, S.; Campbell-Lendrum, D. Quantitative Risk Assessment of the Effects of Climate Change on Selected Causes of Death, 2030s and 2050s. Available online: http://www.who.int/globalchange/publications/quantitative-risk-assessment/en/ (assessed on 5 November 2014).
  29. Fischer, E.M.; Schär, C. Consistent geographical patterns of changes in high-impact European heatwaves. Nat. Geosci. 2010, 3, 398–403. [Google Scholar] [CrossRef]
  30. Cowan, T.; Purich, A.; Perkins, S.; Pezza, A.; Boschat, G.; Sadler, K. More frequent, longer and hotter heat waves for Australia in the 21st century. J. Clim. 2014, 27, 5851–5871. [Google Scholar] [CrossRef]
  31. Koffi, B.; Koffi, E. Heat waves across Europe by the end of the 21st century: Multiregional climate simulations. Clim. Res. 2008, 36, 153–168. [Google Scholar] [CrossRef]
  32. Sheridan, S.C.; Allen, M.J.; Lee, C.C.; Kalkstein, L.S. Future heat vulnerability in California, Part II: projecting future heat-related mortality. Clim. Chang. 2012, 115, 311–326. [Google Scholar] [CrossRef]
  33. Morabito, M.; Crisci, A.; Moriondo, M.; Profili, F.; Francesconi, P.; Trombi, G.; Orlandini, S. Air temperature-related human health outcomes: Current impact and estimations of future risks in Central Italy. Sci. Total Environ. 2012, 441, 28–40. [Google Scholar] [CrossRef] [PubMed]
  34. Petkova, E.P.; Bader, D.A.; Anderson, G.B.; Horton, R.M.; Knowlton, K.; Kinney, P.L. Heat-related mortality in a warming climate: Projections for 12 US cities. Int. J. Environ. Res. Public Health 2014, 11, 11371–11383. [Google Scholar] [CrossRef] [PubMed]
  35. Gosling, S.N.; McGregor, G.R.; Lowe, J.A. The benefits of quantifying climate model uncertainty in climate change impacts assessment: An example with heat-related mortality change estimates. Clim. Chang. 2012, 112, 217–231. [Google Scholar] [CrossRef]
  36. Knowlton, K.; Lynn, B.; Goldberg, R.A.; Rosenzweig, C.; Hogrefe, C.; Rosenthal, J.K.; Kinney, P.L. Projecting heat-related mortality impacts under a changing climate in the New York City region. Am. J. Public Health 2007, 97, 2028–2034. [Google Scholar] [CrossRef] [PubMed]
  37. Lin, S.; Hsu, W.H.; van Zutphen, A.R.; Saha, S.; Luber, G.; Hwang, S.A. Excessive heat and respiratory hospitalizations in New York State: Estimating current and future public health burden related to climate change. Environ. Health Perspect. 2012, 120, 1571–1577. [Google Scholar] [CrossRef] [PubMed]
  38. Hajat, S.; Kosatky, T. Heat-related mortality: A review and exploration of heterogeneity. J. Epidemiol. Community Health 2010, 64, 753–760. [Google Scholar] [CrossRef] [PubMed]
  39. Marti-Soler, H.; Gonseth, S.; Gubelmann, C.; Stringhini, S.; Bovet, P.; Chen, P.C.; Wojtyniak, B.; Paccaud, F.; Tsai, D.H.; Zdrojewski, T.; et al. Seasonal variation of overall and cardiovascular mortality: A study in 19 countries from different geographic locations. PLoS One 2014, 9, e113500. [Google Scholar] [CrossRef] [PubMed]
  40. Li, T.; Horton, R.M.; Kinney, P.L. Projections of seasonal patterns in temperature-related deaths for Manhattan, New York. Nat. Clim. Chang. 2013, 3, 717–721. [Google Scholar] [CrossRef] [PubMed]
  41. Stafoggia, M.; Forastiere, F.; Michelozzi, P.; Perucci, C.A. Summer temperature-related mortality: Effect modification by previous winter mortality. Epidemiology 2009, 20, 575–583. [Google Scholar] [CrossRef] [PubMed]
  42. Bassil, K.L.; Cole, D.C. Effectiveness of public health interventions in reducing morbidity and mortality during heat episodes: a structured review. Int. J. Environ. Res. Public Health 2010, 7, 991–1001. [Google Scholar] [CrossRef] [PubMed]
  43. Heudorf, U.; Schade, M. Heat waves and mortality in Frankfurt am Main, Germany, 2003–2013: What effect do heat-health action plans and the heat warning system have? Z. Gerontol. Geriatr. 2014, 47, 475–482. [Google Scholar] [CrossRef] [PubMed]

