 Usman Saeed
 Anthony E. Lang2,3
 Mario Masellis
- 1Hurvitz Brain Sciences Program, Sunnybrook Research Institute, Toronto, ON, Canada
- 2Division of Neurology, Department of Medicine, University of Toronto, Toronto, ON, Canada
- 3Edmond J Safra Program in Parkinson's Disease and the Morton and Gloria Shulman Movement Disorders Clinic, Toronto Western Hospital, University Health Network, Toronto, ON, Canada
- 4L.C. Campbell Cognitive Neurology Research Unit, Sunnybrook Health Sciences Center, Toronto, ON, Canada
- 5Cognitive and Movement Disorders Clinic, Sunnybrook Health Sciences Center, Toronto, ON, Canada
Parkinson's disease (PD) and atypical Parkinsonian syndromes are progressive heterogeneous neurodegenerative diseases that share clinical characteristic of parkinsonism as a common feature, but are considered distinct clinicopathological disorders. Based on the predominant protein aggregates observed within the brain, these disorders are categorized as, (1) α-synucleinopathies, which include PD and other Lewy body spectrum disorders as well as multiple system atrophy, and (2) tauopathies, which comprise progressive supranuclear palsy and corticobasal degeneration. Although, great strides have been made in neurodegenerative disease research since the first medical description of PD in 1817 by James Parkinson, these disorders remain a major diagnostic and treatment challenge. A valid diagnosis at early disease stages is of paramount importance, as it can help accommodate differential prognostic and disease management approaches, enable the elucidation of reliable clinicopathological relationships ideally at prodromal stages, as well as facilitate the evaluation of novel therapeutics in clinical trials. However, the pursuit for early diagnosis in PD and atypical Parkinsonian syndromes is hindered by substantial clinical and pathological heterogeneity, which can influence disease presentation and progression. Therefore, reliable neuroimaging biomarkers are required in order to enhance diagnostic certainty and ensure more informed diagnostic decisions. In this article, an updated presentation of well-established and emerging neuroimaging biomarkers are reviewed from the following modalities: (1) structural magnetic resonance imaging (MRI), (2) diffusion-weighted and diffusion tensor MRI, (3) resting-state and task-based functional MRI, (4) proton magnetic resonance spectroscopy, (5) transcranial B-mode sonography for measuring substantia nigra and lentiform nucleus echogenicity, (6) single photon emission computed tomography for assessing the dopaminergic system and cerebral perfusion, and (7) positron emission tomography for quantifying nigrostriatal functions, glucose metabolism, amyloid, tau and α-synuclein molecular imaging, as well as neuroinflammation. Multiple biomarkers obtained from different neuroimaging modalities can provide distinct yet corroborative information on the underlying neurodegenerative processes. This integrative “multimodal approach” may prove superior to single modality-based methods. Indeed, owing to the international, multi-centered, collaborative research initiatives as well as refinements in neuroimaging technology that are currently underway, the upcoming decades will mark a pivotal and exciting era of further advancements in this field of neuroscience.
Background
Parkinsonism defined by the presence of cardinal clinical motor features of rigidity, bradykinesia and tremor impacts the functioning of affected patients and can result in a significant loss of quality of life. Parkinson's disease (PD) is the most prevalent cause of neurodegenerative parkinsonism affecting more than 10 million individuals globally and bears a huge socioeconomic burden (1). The motor symptoms of PD, especially as seen in the early stages of the disease, are largely due to the loss of dopamine-producing neurons within the substantia nigra pars compacta (SNpc), whereas non-motor features that include olfactory and autonomic dysfunction, sleep disorders, psychiatric symptoms, depression, pain, fatigue, and cognitive impairment result from a more widespread neurodegeneration involving other neurotransmitter systems (2). On the basis of dopaminergic denervation, PD patients typically show a good response to levodopa. Conversely, the atypical Parkinsonian syndromes (PS) are a group of heterogenous neurodegenerative diseases that also present with parkinsonism, although they generally do not respond well to levodopa treatment and are considered distinct clinicopathological disorders.
Neurodegenerative diseases causing parkinsonism are categorized based on the predominant protein aggregates found within the brain, which are believed to be intimately involved in the underlying pathogenic mechanisms. Lewy body spectrum disorders (LBSD), including PD with and without cognitive impairment, Parkinson's disease dementia (PDD) and dementia with Lewy bodies (DLB) as well as multiple system atrophy (MSA) are classified as α-synucleinopathies due to the presence of misfolded α-synuclein aggregates. Progressive supranuclear palsy (PSP) and corticobasal degeneration (CBD) are categorized as tauopathies due to the preponderance of aggregated tau inclusions within the brain. With better understanding of these syndromes, the presence of “mixed” pathologies is increasingly being recognized. Indeed, concomitant aggregation of amyloid, tau, and α-synuclein proteins within the brain contribute to substantial heterogeneity in disease presentation and progression. The core neuropathological and clinical characterization of tauopathies and α-synucleinopathies are detailed in Table 1.
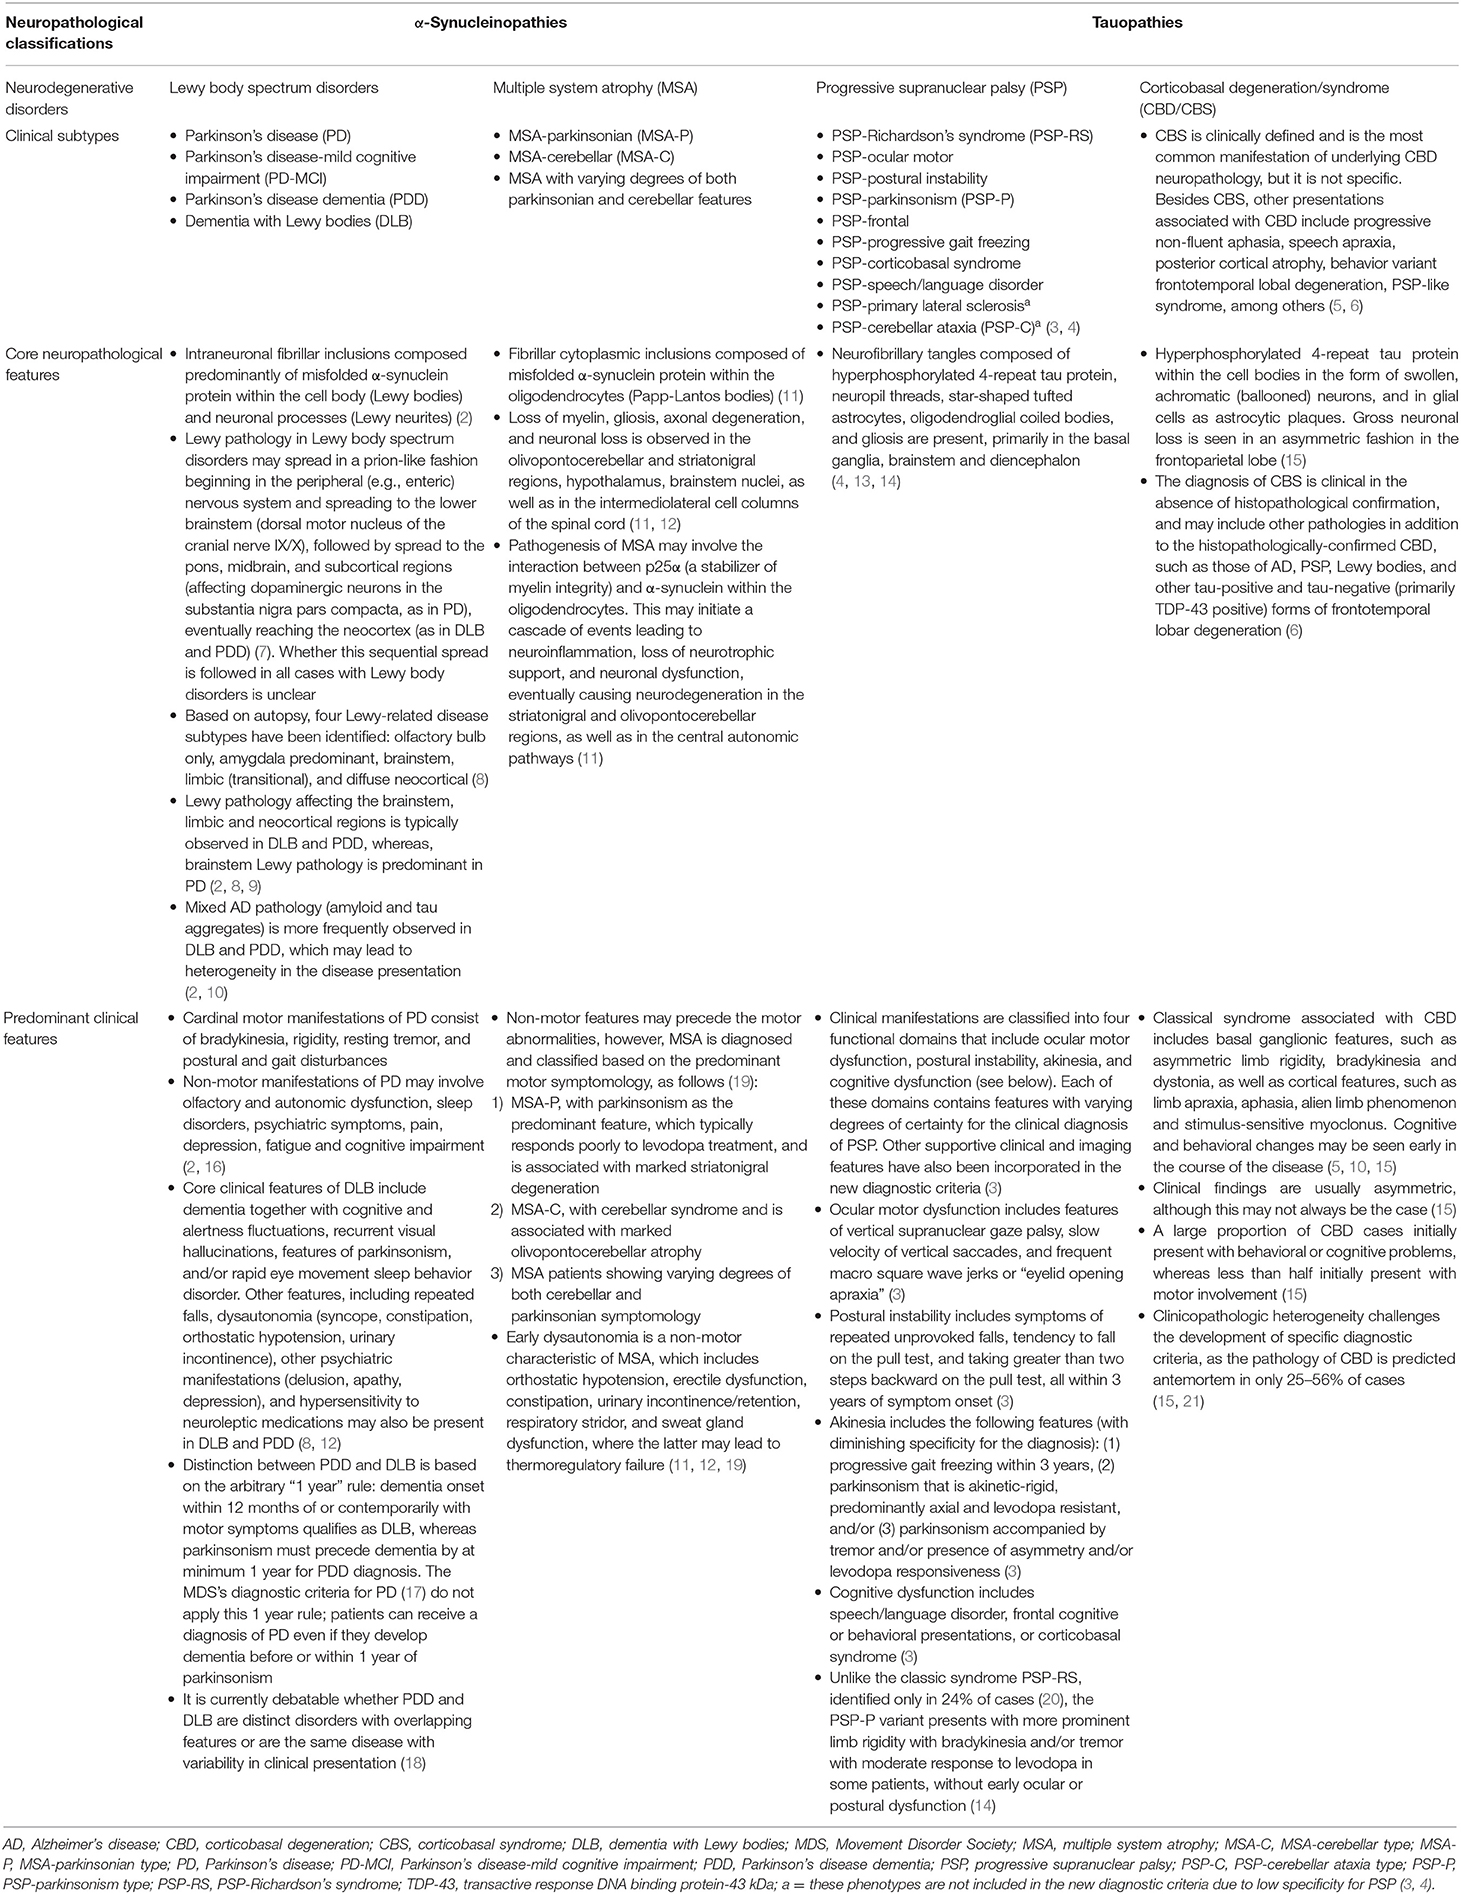
Table 1. Neuropathological and clinical characteristics of α-synucleinopathies and tauopathies.
Our understanding of PD and atypical PS has been significantly enhanced by methodological and analytical improvements in in vivo neuroimaging techniques. Neuroimaging can be used to: (1) identify disease-specific structural and functional biomarkers, some of which have been incorporated into the diagnostic criteria and may serve to enhance diagnostic confidence, (2) rule out unrelated abnormalities (e.g., neoplasms, strokes, extensive cerebrovascular pathology) as primary or contributory cause of the symptoms, (3) validate promising prodromal biomarkers for diagnostic purposes, which may also assist in patient recruitment or sample enrichment for therapeutic trials, (4) quantify whole-brain or regional burden of misfolded neuropathological molecules (e.g., amyloid, tau, or α-synuclein and their co-aggregation) as well as other physiological processes (e.g., neuroinflammation), and (5) study disease progression over time or in response to therapeutic interventions via the evaluation of neuroimaging-based secondary outcome measures. Several neuroimaging modalities have been developed and applied to Parkinsonian disorders, each providing distinct information on the underlying brain disorders. An overview of the common neuroimaging techniques is summarized in Table 2.
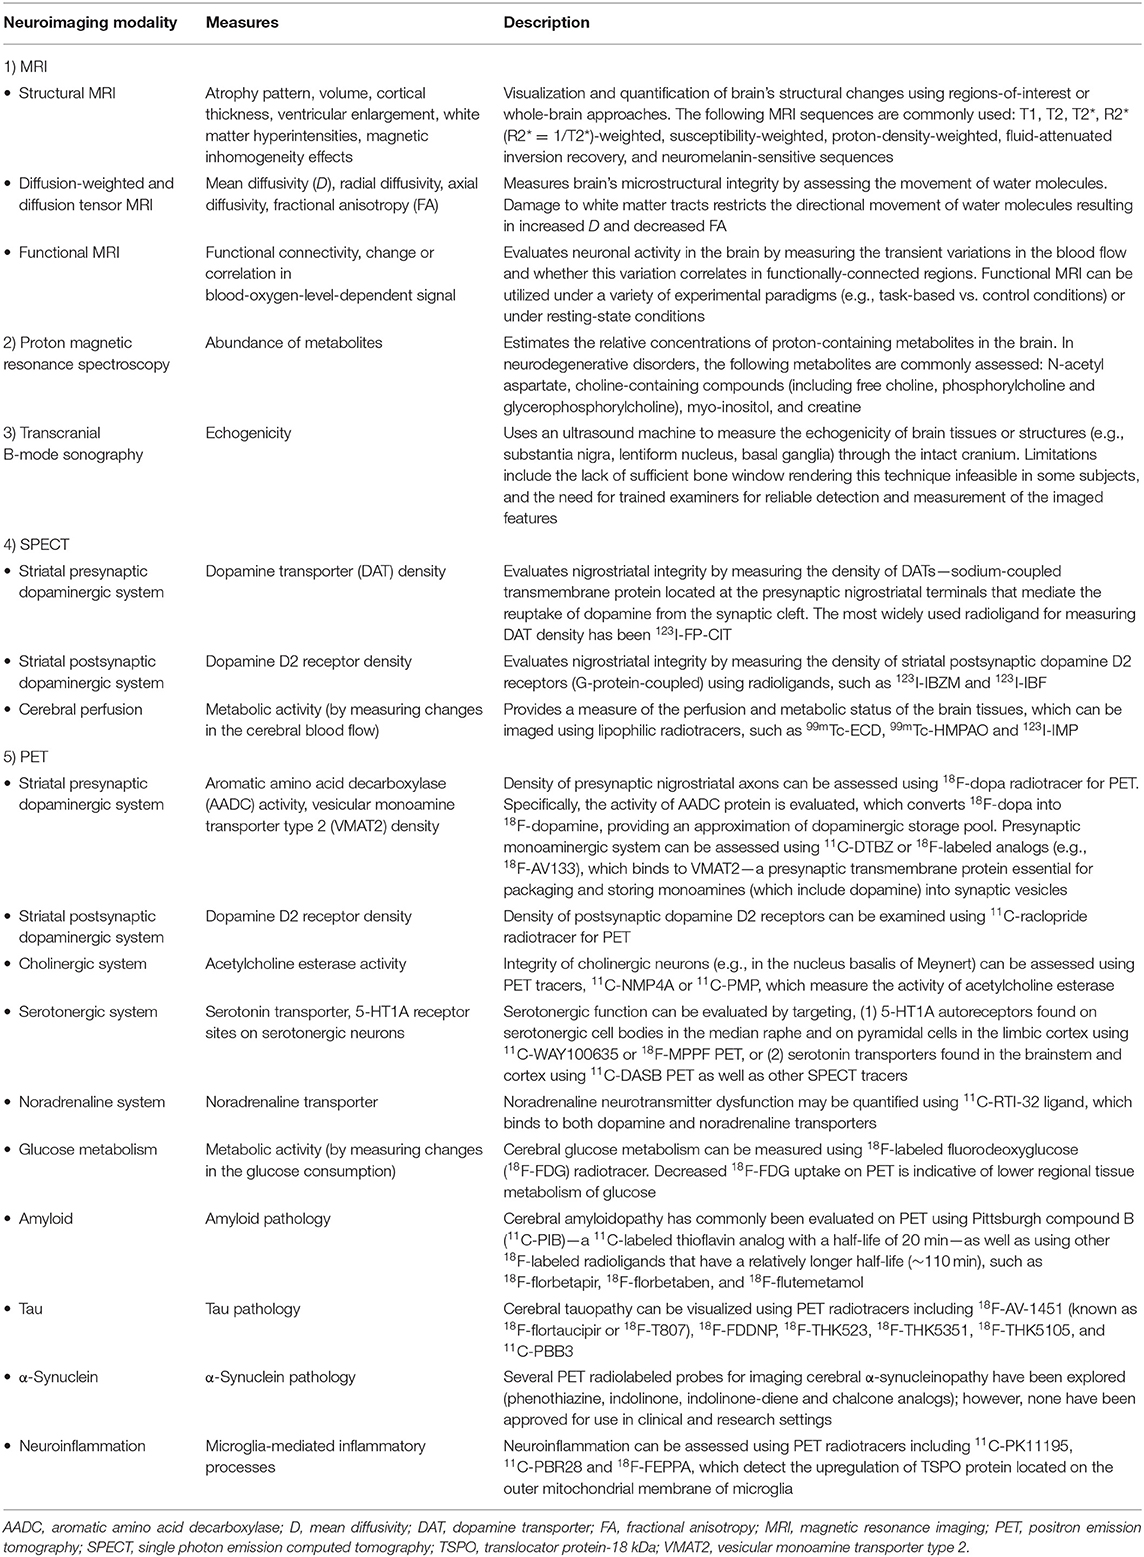
Table 2. An overview of the common neuroimaging modalities discussed in this article.
In this review, a comprehensive presentation of the current and emerging biomarkers from multiple neuroimaging modalities in PD and atypical PS will be undertaken with emphasis on some of the distinguishing characteristics.
Search Strategy
The literature search was performed on the PubMed database using the following disease-specific keywords: “Parkinson*,” “Lewy*,” “multiple system atrophy,” “corticobasal degeneration,” “progressive supranuclear palsy” —together with one of the modality-specific keywords: “magnetic resonance imaging,” “positron emission tomography,” “single-photon emission computed tomography,” “diffusion tensor,” “diffusion-weighted,” “proton spectroscopy,” and “transcranial sonography.” Acronyms, e.g., “PET” for “positron emission tomography,” were entered as appropriate. The literature search was restricted to articles written in English, and published between January 1, 1995 and December 31, 2019. All abstracts were screened for relevance. The most pertinent articles were then read and discussed.
Structural Neuroimaging in Parkinsonian Disorders
Parkinson's Disease (PD)
Structural Magnetic Resonance Imaging in PD
Structural changes on conventional magnetic resonance imaging (MRI) are minimal and less apparent, especially in early stages of PD (10). A six-stage model depicting the sequential progression of α-synuclein pathology in PD has been proposed by Braak et al. (7) (Figure 1). As per this “gut to brain” transmission model, neuroimaging studies may predominantly observe brainstem and subcortical involvement in early PD stages with greater cortical involvement in late stage PD as well as in PD-MCI, PDD and DLB cases. Compared to normal controls, voxel-based morphometry (VBM) studies in PD may identify atrophy in the basal ganglia (22) (as consistent with nigrostriatal degeneration and consequential dysfunction in the basal ganglia thalamocortical circuit), frontal lobe (23), and non-specifically in the right hippocampus, left anterior cingulate and superior temporal gyri (24). Although inconsistently shown, cortical thinning in the orbitofrontal, ventrolateral prefrontal, and occipitoparietal cortical regions has been identified in PD, along with volumetric reductions in the caudate and putamen (25, 26). Some studies do not observe appreciable differences on conventional MRI compared to controls (27, 28). In PD patients with olfactory disturbances, reduced volume in the olfactory bulb and tract was evident vs. MSA and controls (29). In PD patients with respiratory dysfunction, gray matter (GM) atrophy was reported in the left parahippocampal formation, right fusiform gyrus, right cerebellum crus, and left postcentral gyri compared to PD with normal pulmonary functions (30). Freezing of gait symptomatology in PD was associated with posterior GM atrophy (specifically, left cuneus, precuneus, lingual gyrus, and posterior cingulate cortex) (27). In advanced PD, atrophy in the subcortical GM structures was found to be more pronounced vs. those in early PD stages (31) (Figure 2).
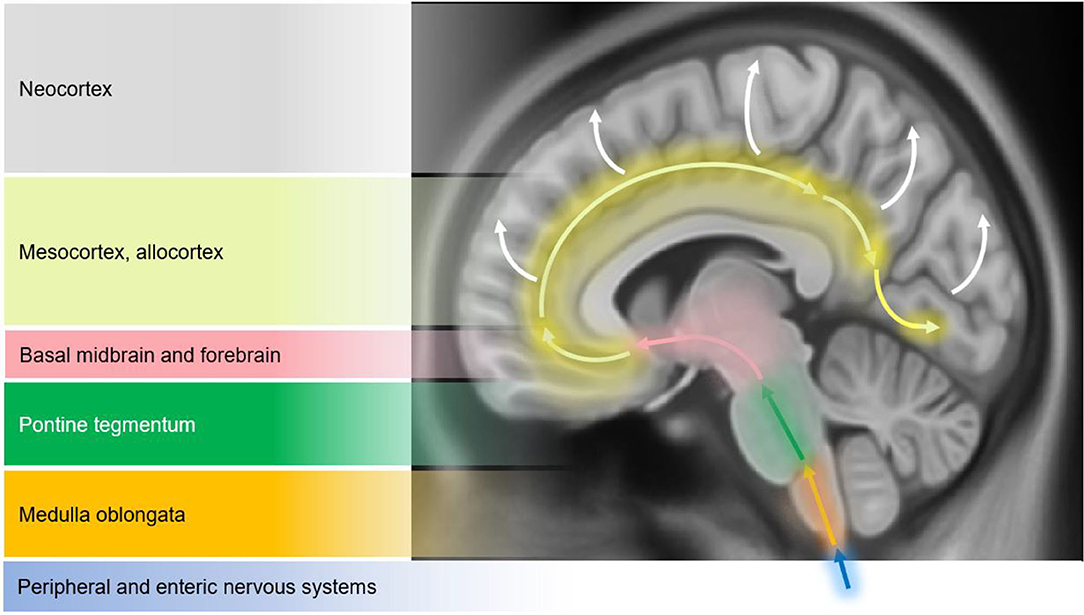
Figure 1. Schematic diagram illustrating the progression of α-synuclein pathology (Lewy bodies and Lewy neurites) in Parkinson's disease (PD), as proposed by Braak et al. (7). According to the Braak model, α-synuclein pathology in the brain spreads caudo-rostrally in a characteristic pattern starting in stage I and II in the lower brainstem regions of medulla oblongata and pons (dorsal motor nucleus of the cranial nerve IX/X, raphe nuclei, gigantocellular reticular nucleus, and coeruleus-subcoeruleus complex). In stages III and IV, α-synucleinopathy spreads further to the susceptible regions of the midbrain (e.g., dopaminergic neurons in the substantia nigra pars compacta), forebrain (e.g., hypothalamus, thalamus, and limbic system), as well as involving some of the cortical regions in the temporal mesocortex (transentorhinal region) and allocortex. In the last two stages (V and VI), α-synuclein pathology reaches the neocortex contributing to cognitive dysfunction (as seen in dementia with Lewy bodies and PD dementia). It is hypothesized that the initiation site of α-synuclein pathology may be outside the central nervous system (CNS), probably beginning in the peripheral (enteric) nervous system and gaining access to the CNS through retrograde transport mechanisms in a prion-like fashion. Whether this sequential spread of α-synuclein pathology as proposed by the Braak model is followed in all cases in Lewy body spectrum disorders is less clear. Figure adapted from Visanji et al. (32), under the Creative Commons Attribution License (https://creativecommons.org/licenses/by/2.0/).
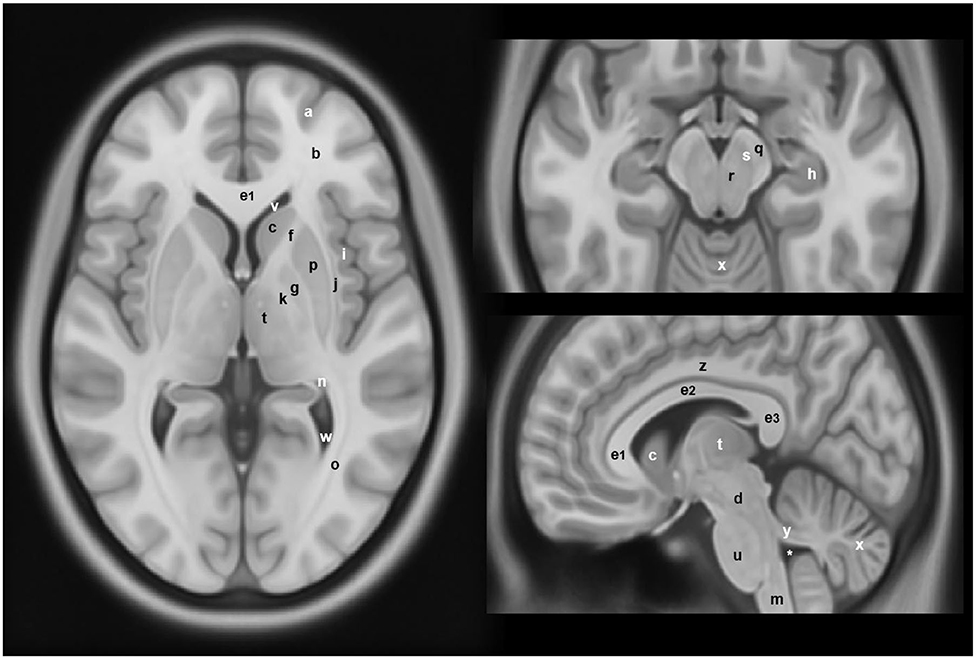
Figure 2. Anatomical locations of some of the structures and regions important in Parkinson's disease and atypical Parkinsonian syndromes, highlighted on a standard averaged T1-weighted MNI template for normal population. Labeling: a = cerebral gray matter (frontal lobe), b = cerebral white matter (frontal lobe), c = head of caudate nucleus, d = midbrain, e1 = genu of corpus callosum, e2 = body of corpus callosum, e3 = splenium of corpus callosum, f = anterior limb of internal capsule, g = globus pallidus, h = hippocampus, i = insular cortex, j = claustrum, k = posterior limb of internal capsule, m = medulla oblongata, n = tail of caudate nucleus, o = optic radiation, p = putamen, q = crus cerebri (anterior portion of cerebral peduncle), r = red nucleus, s = substantia nigra, t = thalamus, u = pons, v = anterior horn of lateral ventricle, w = posterior horn of lateral ventricle, x = cerebellum, y = superior cerebellar peduncle, z = cingulate gyrus, * = fourth ventricle. Note: p and g together constitute the lentiform nucleus; c and p together constitute the dorsal striatum. The template was obtained from McConnell Brain Imaging Center, Montreal Neurological Institute, McGill University Copyright 1993–2004 Fonov et al. (33).
Changes within the SN may emerge as promising early diagnostic biomarkers of PD (10). Within the SNpc, calbindin-negative pockets termed “nigrosomes” are observed (34). The greatest loss in neuromelanin containing neurons takes place in the nigrosome-1, which is located in the caudal and mediolateral portion of SNpc (35). Nigrosome-1 shows a significant loss of hyperintensity on T2* and neuromelanin-sensitive MRI in PD, probably caused by decreased neuromelanin, increased iron content, or loss of paramagnetic neuromelanin–iron complexes (36–38). On susceptibility-weighted imaging (modality of choice), healthy nigrosome-1 and the surrounding neuroanatomy of the dorsolateral SN may appear as the tail of a swallow bird (“swallow-tail” sign). Loss of this feature in PD vs. controls may assist in the differential diagnosis (sensitivity 80%, specificity 89%) (39, 40) (Figure 3). Finally, neuromelanin-sensitive MRI has shown promise in the differentiation of PD from essential tremor and normal controls (37, 41), and this technique may prove invaluable as a marker of disease progression in PD.
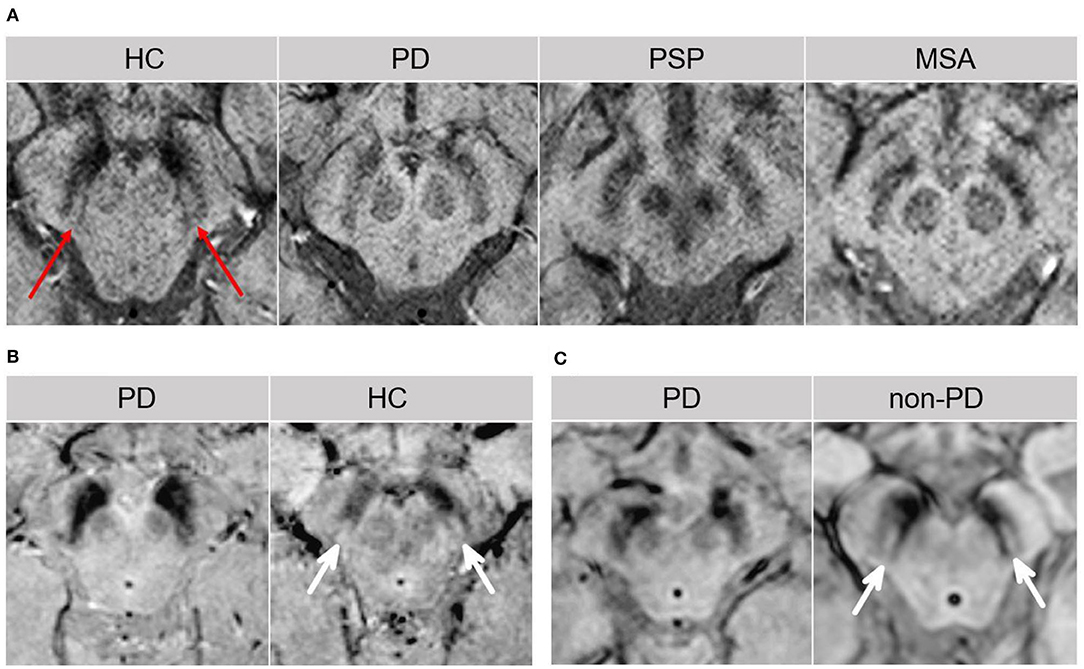
Figure 3. The “swallow tail” sign. All MRI presented above are taken at the level of substantia nigra in the midbrain. (A) Susceptibility-weighted MRI depicting dorsolateral nigral hyperintensity (the “swallow tail” sign, red arrows) in a healthy control. Loss of dorsolateral nigral hyperintensity can be seen in PD and may even be seen in some PSP and MSA cases on susceptibility-weighted MRI. (B) High resolution susceptibility-weighted MRI (gradient echo-echo planar imaging sequence, magnitude image) is shown for a PD patient and a control. (C) High resolution T2*/susceptibility-weighted MRI (multi-shot fast field echo-echo planar imaging sequence) is shown for a PD patient and a non-PD case who was diagnosed with aneurysmal subarachnoid hemorrhage. In both (B,C), loss of dorsolateral nigral hyperintensity (white arrows) corresponding to nigrosome-1 can be seen in PD as compared to control and a non-PD subject. (A) was adapted from Chougar et al. (40), and (B,C) were adapted from Schwarz et al. (39), under the Creative Commons Attribution License (https://creativecommons.org/licenses/by/4.0/). HC, healthy control; MSA, multiple system atrophy; PD, Parkinson's disease; PSP, progressive supranuclear palsy.
In PD patients with polysomnography-confirmed rapid eye movement sleep behavior disorder (RBD), cortical thinning was reported in the right perisylvian and inferior temporal cortices together with shape changes in the putamen compared to PD without RBD (42). Likewise, decreased volume in the right putamen correlating with RBD symptom severity was identified in PD with RBD vs. those without (43). On susceptibility-weighted imaging, loss of dorsal nigral hyperintensity (corresponding to nigrosome-1) was observed in ~25% of patients with idiopathic RBD, which associated with lower putaminal dopamine transporter (DAT) binding on single-photon emission computed tomography (SPECT) (44). This may suggest nigrosome-1 degeneration in some of the RBD cases, likely those at risk of progression to PD (44). These studies propose a link between PD, the presence of RBD, and greater neurodegeneration especially in subcortical structures.
Volumetric changes in the SN have been inconsistently reported in PD vs. controls (45–48). A high resolution examination of structural alterations in the SN is possible using ultra-high-field MRI (49). For example, susceptibility-weighted imaging at 7T permitted the visualization of the anatomical layers of the SN, allowing excellent discrimination between PD and controls (sensitivity 100%, specificity 96.2%) (50). Correlations between motor symptoms and increased R2* (apparent transverse relaxation rate, R2* = 1/T2*) values in the SN have also been reported in PD (46, 51–53), which may reflect ferritin-induced magnetic field inhomogeneities. A recent study applied quantitative susceptibility mapping in PD to evaluate the magnetostatic alterations caused by changes in the iron distribution across the whole brain (54). The apparent magnetic susceptibility was found to be elevated in the dorsal and ventral SN, rostral pontine regions, and the cortex (primarily in the temporal paralimbic, prefrontal, and occipitoparietal regions) (54). Conversely, reduced magnetic susceptibility was detected in the normally iron-rich cerebellar region of the dentate nucleus suggesting decreased iron content (54). Interestingly, the striatum as well as the primary motor and somatosensory fields were spared (54). Future research will highlight whether iron accumulation is the consequence or cause of neurodegenerative changes associated with PD.
Diffusion-Weighted and Diffusion Tensor Imaging in PD
Reduced fractional anisotropy (FA) in the SN is commonly observed in PD (55, 56). Increased mean diffusivity (D) in the olfactory tracts and decreased FA in the anterior olfactory structures have been reported (57, 58), as consistent with neuronal loss observed in these regions (29). Significant differences in D or FA may not be evident in early PD due to milder neurodegeneration (59, 60). Combined analysis of diffusion parameters and apparent transverse relaxation rates was found to be superior in differentiating PD vs. MSA-P (sensitivity 97%, specificity 100%, positive predictive value [PPV] 100%, negative predictive value [NPV] 93%), and PD vs. MSA-P/PSP group (sensitivity 86%, specificity 87%, PPV 88%, NPV 84%) (61). In SNpc (delineated using a probabilistic atlas based on neuromelanin sensitive imaging), asymmetric alterations predominantly in the diffusion metrices rather than anisotropy were observed (62).
PD-MCI cases showed increased D as well as lower GM volume in the nucleus basalis of Meynert vs. cognitively normal PD (60). The degeneration of this cholinergic structure may identify patients at risk of more significant cognitive decline and dementia (60). Another study delineated the cortical projections of five corpus callosum segments and highlighted the role of callosal white matter (WM) abnormalities in cognitive dysfunction, which can occur via disruption of interhemispheric information transfer along callosal-cortical projections (63). In PD, increased axial diffusivity was identified in the three anterior callosal segments (projecting to prefrontal, premotor, motor, and supplementary motor cortices) vs. controls (63). Cognitive performance strongly related to diffusion tensor imaging (DTI) metrics in the most anterior (projecting to prefrontal cortex) and most posterior callosal sections (projecting to parietal, temporal, and occipital cortex), which may contribute to “fronto-striatal” and “posterior cortical” types of cognitive deficits seen in PD, respectively (63).
Free water was elevated in PD in posterior SN vs. controls (52, 64, 65). Increase in free water in posterior SN over time was observed in de novo PD patients, which was associated with motor severity and putaminal DAT SPECT binding (64). Given the posterior-to-anterior pattern of degenerative changes reported in SN, elevated free-water may also be observed in the anterior SN (66), especially in late-stage idiopathic PD (67). In contrast, free-water-corrected FA values were found to be unchanged in PD vs. controls, as assessed using the bi-tensor diffusion model (66, 68). Free-water and free-water-corrected FA values beyond SN and from multiple brain regions may help distinguish PD, MSA, and PSP cases from each other (66).
Proton Magnetic Resonance Spectroscopy in PD
Reduced N-acetyl aspartate/creatine (NAA/Cr) ratios in the SN have been observed in PD vs. controls, which were shown to correlate with disease severity (69, 70). Lowered NAA or NAA/Cr values have also been detected in other regions, including the lentiform nucleus (LN) (comprises of putamen and globus pallidus; basic anatomy presented in Figure 2), temporoparietal and posterior cingulate cortex, and pre-supplementary motor area vs. controls (71–74). However, the correlation between NAA/Cr ratios in these regions with disease severity or duration is inconsistently reported (72, 73). Another study compared the NAA/Cr ratios in the rostral and caudal SN, and found lower values in the rostral region in PD, whereas this pattern was inverted in the atypical PS group and controls (75). In tremor-dominant PD, reduced NAA/Cr and Choline/Cr values were detected in the thalamus vs. patients with essential tremor presenting with resting tremor (76). Cerebellar NAA/Cr and NAA/myo-inositol ratios were smaller in the atypical PS group compared to PD and controls (77). One study has also suggested the utility of proton magnetic resonance spectroscopy for the evaluation of treatment efficacy in PD (78). Specifically, the putaminal levels of myo-inositol, total Cr, and total NAA metabolites were reduced in the drug-off condition in PD vs. healthy controls. The administration of levodopa resulted in the restoration of total Cr and total NAA levels suggesting therapeutic responsiveness (78).
Lewy Body Spectrum Disorders (LBSD)
Structural Magnetic Resonance Imaging in LBSD
In DLB and PDD, conventional MRI typically shows variable changes. Compared to controls, VBM studies in PDD have identified a diffuse pattern of cortical atrophy involving the occipital, temporal, right frontal, and left parietal lobe (23), as well as atrophy involving the putamen, hippocampus, parahippocampal region, anterior cingulate gyrus, nucleus accumbens and the thalamic nuclei (24). Although inconsistently reported (23), a greater cortical loss in the temporal, occipital, and parietal lobes was noted in DLB vs. PDD (79). Indeed, pathological heterogeneity evident in these two closely related α-synucleinopathies is in part responsible for variable findings. Compared to PD, atrophy in the occipital lobe and entorhinal cortex may help differentiate PDD (23, 80).
The relative preservation of total hippocampus compared to AD is a supportive diagnostic feature of DLB (8). Within the hippocampus, the CA1 subfield shows preservation (81), which aligns with the histopathological evidence showing Lewy body aggregates and neuronal loss largely localized to the CA2/3 subfields in DLB cases (81, 82). Conversely, atrophy in the CA1 subfield is indicative of neurofibrillary tangle pathology as evident in AD. Hippocampal atrophy is in fact observed in LBSD, controls and AD in a characteristic pattern [controls < PD < PDD/DLB < AD (9, 83)] and the extent of atrophy aligns with the underlying concomitant AD-type pathology (9). Smaller caudate and putaminal volumes have also been reported in PD and DLB vs. AD and controls, albeit inconsistently (26, 84). WM hyperintensities are more prevalent in PDD and DLB vs. PD and controls (85).
PD-MCI patients may show greater cortical thinning in temporoparietal, occipital, and supplementary motor area vs. cognitively-normal PD (86). A recent meta-analysis evaluating VBM studies identified pronounced GM atrophy in the left anterior insula in PD-MCI vs. cognitively-normal PD cases (87). Longitudinal cognitive decline in PD was associated with an AD-like pattern of cerebral atrophy at baseline, underscoring the contribution of the hippocampus and temporoparietal cortex in the cognitive sequelae of PD (88).
The ε4-allele of the apolipoprotein E gene (APOE-ε4) is a shared risk factor for AD, PDD, and DLB disorders (89). Therefore, the identification of neuroimaging and cognitive endophenotypes of APOE-ε4 irrespective of the clinical diagnosis has been pursued (9). Recent investigations indicate that APOE-ε4 is related to hippocampal atrophy along with learning and memory performance in DLB as well as across the AD/DLB spectrum, implicating APOE-ε4-associated shared neurodegenerative mechanisms across these disorders (9). Similarly, MRI-derived WM hyperintensity burden was inversely related to learning/memory, attention/executive and language performances in APOE-ε4 carriers across the AD/DLB spectrum (90). In addition to the APOE-ε4's influence on amyloidopathy, these results are consistent with the emerging evidence indicating an independent role of APOE-ε4 in modulating α-synucleinopathy in the brain (91).
Diffusion-Weighted and Diffusion Tensor Imaging in LBSD
In DLB vs. controls, diffusion imaging studies reveal D and FA abnormalities in the corpus callosum, pericallosal regions, caudate nucleus (suggestive of nigrostriatal involvement), amygdala, inferior longitudinal fasciculus, precuneus, as well as in the frontal, parietal, and occipital WM with milder involvement of the temporal lobe early in the disease (92–94). In DLB, elevated D in the amygdala (a region preferentially affected by Lewy pathology) was observed in the absence of significant GM density changes, probably suggesting microvacuolation or spongiosis as one of the possible mechanisms (93). Increased D in the longitudinal fasciculus was identified in DLB patients with hallucinations vs. those without (93). In PDD, reduced FA in the bilateral posterior cingulate bundle was reported vs. PD (95). Compared to AD, decreased FA was noted in the pons and left thalamus in DLB (96). However, given the significant pathological overlap between AD and DLB, diffusion imaging studies may not reveal consistent findings, particularly in subjects at advanced disease stages (94).
Proton Magnetic Resonance Spectroscopy in LBSD
In DLB, lower NAA/Cr ratios in the bilateral hippocampus were evident relative to controls (97), albeit milder than typically seen in AD. Lower NAA/Cr ratios were observed in the posterior cingulate gyrus in PDD vs. cognitively normal PD patients (98).
Multiple System Atrophy (MSA)
Magnetic Resonance Imaging in MSA
Several visible features that may be identifiable on conventional MRI have been reported. On T2-weighted images, these include the presence of bilateral hyperintense rim lining the dorsolateral borders of the putamen (“putaminal rim” sign) and putaminal hypointensity in MSA-parkinsonian subtype (MSA-P) cases (11, 99). In addition, atrophy of the putamen, cerebellum, middle cerebellar peduncles (MCP), or pons may be noticed. In MSA-cerebellar subtype (MSA-C), visible features on T2-weighted and fluid-attenuated inversion recovery images may include cruciform pontine hyperintensity (“hot cross bun” sign; specificity 100%, sensitivity 58%; Figure 4a) and hyperintensity in the MCP (MCP sign; specificity 100%, sensitivity 50%; Figure 4b) (11, 99). Atrophy of the putamen, pons, cerebellum or MCP may be evident on T1-weighted images (Figure 4c). Notably, these signs have low sensitivity values and the appearance of these MRI markers can be influenced by image acquisition factors. For example, the “hot cross bun” sign was suggested to be more conspicuous on T2*-weighted vs. T2-weighted images (100), probably due to the presence of increased iron (100, 101).
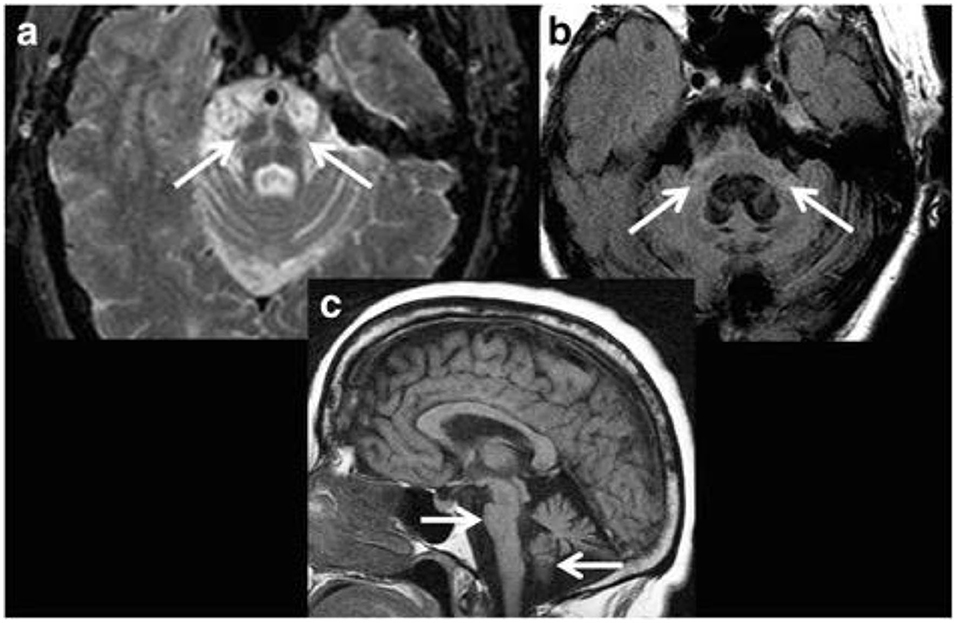
Figure 4. Magnetic resonance imaging of a patient clinically-diagnosed with multiple system atrophy (cerebellar type). (a) Axial proton density weighted sequence is presented at the level of pons, which shows cruciform pontine T2 hyperintensity as consistent with the “hot cross bun” sign, resulting from selective susceptibility of the pontocerebellar tract in multiple system atrophy (cerebellar type). In addition, disproportionate atrophy of the pons and partially visible cerebellar hemispheres are also apparent. (b) Axial fluid-attenuated inversion recovery (FLAIR) sequence is presented with cruciform T2 hyperintensity within the pons and middle cerebellar peduncles (i.e., “middle cerebellar peduncle” sign) along with marked atrophy. In addition, cerebellar hemispheric and vermian atrophy is evident with ex vacuo dilatation of the fourth ventricle. (c) Sagittal T1-weighted sequence is presented showing disproportionate atrophy of the brainstem and cerebellar vermis. Figure reproduced from Saeed et al. (10), under the Creative Commons Attribution License 4.0 (https://creativecommons.org/licenses/by/4.0/).
The volume of the putamen was found to be significantly reduced in MSA vs. PD cases (102). While putaminal atrophy has been shown to differentiate MSA/MSA-P from PD with high specificity (~92%), a rather low sensitivity (~44%) was noted (99, 103). When putaminal changes are present and are asymmetric, they reliably correlate with the asymmetry of clinical features in patients with MSA-P. Several studies suggest that the analysis of multiple biomarkers may improve differentiation. For example, combined analysis of putaminal hypointensity visualized on gradient echo sequence along with putaminal atrophy improved the overall diagnostic accuracy of MSA-P cases vs. PD and PSP (104). Likewise, analyzing DTI and R2* relaxation rate together enabled the identification of abnormal patterns unique to PD, PSP, and MSA disorders (61). On the other hand, a multimodal study (incorporating R2*, R1, and R2 mapping, magnetization transfer and DTI) found elevated putaminal R2* values to be superior in the differentiation of MSA-P from PD, likely representing iron accumulation in the putamen (105).
In MSA vs. controls, volumetric and VBM studies commonly show striatonigral and olivopontocerebellar atrophy (11). Reduced volumes in the striatum and brainstem areas were observed in MSA vs. PD (28, 106), although with extensive overlap with PSP cases (28). In MSA-P, VBM studies also show atrophy in the primary motor and supplementary motor cortex indicating sensorimotor cortical degeneration (106, 107), as well as in the prefrontal and insular cortices compared to PD (106). Likewise, VBM analysis in MSA-P vs. PD revealed atrophy in the superior cerebellar peduncle (SCP), MCP, cerebellum, pons, midbrain, and putamen, but not in the globus pallidus (71). Cerebellar atrophy was evident in both MSA-P and MSA-C subtypes to varying degrees (28, 108). In an analysis of cerebellar neuroanatomical differences in MSA subtypes, a relatively greater GM atrophy was observed in MSA-C cases (vs. MSA-P) in the right Crus II—a cerebellar region involved in executive motor control (108). Both MSA-P and MSA-C patients may exhibit putaminal and infratentorial atrophy with considerable overlap, however, putaminal/supratentorial atrophy was more predominant in MSA-P subtype, whereas infratentorial atrophy was more prominent in MSA-C subtype (109, 110).
MSA patients with cognitive impairment showed volumetric reduction in the left dorsolateral prefrontal cortex vs. cognitively-normal MSA cases (111). The authors suggested that cortical pathology contributes minimally to cognitive deficits in MSA, whereas frontostriatal degeneration may be the primary driver of cognitive dysfunction (as per the concept of “subcortical cognitive impairment”) (111). Another study identified cortical thinning in the parahippocampal and lingual cortices in MSA with dementia vs. cognitively-normal MSA patients (112).
Diffusion-Weighted and Diffusion Tensor Imaging in MSA
In MSA-P, higher D was identified in the putamen compared to subjects with PD, MSA-C and controls (113). Similarly, reduced FA and elevated apparent diffusion coefficient (ADC) values were observed in MSA-P in the putamen, cerebellum and pons vs. PD and controls (114). Combined analysis of elevated T2* relaxation rate and putaminal D allowed discrimination of PD from MSA-P with high accuracy (113). Likewise, a multiregional evaluation of diffusivity changes in the pons, putamen and cerebellum was found to be more useful than single-region analysis (114). Compared to PSP, increased D was observed in MCP and pons in MSA cases, which correlated with cerebellar ataxia in these regions (115). In a comparison between MSA-P and MSA-C subtypes, elevated ADC values were observed in the putamen and pons in MSA-P cases vs. MSA-C, and in the cerebellum and MCP in MSA-C cases vs. MSA-P, highlighting distinct microstructural damage in these subtypes (116). Microstructural changes in the WM may be more pronounced early in the disease in MSA-C than in MSA-P (110). In MSA patients with cognitive impairment, a greater involvement of the cerebrum (specifically, reduced FA in the anterior corpus callosum) was identified compared to cognitively-normal MSA patients (117).
Using the bi-tensor diffusion analysis model, free-water was found to be elevated in the posterior SN in PSP, MSA, and PD vs. controls, however, this increase was significantly greater in PSP than in PD/MSA patients (118). In addition, depending upon the disease severity, free-water may be elevated in both the anterior and posterior SN in PD, MSA and PSP vs. controls (66). Free-water-corrected FA was elevated in MSA in the putamen and caudate vs. controls; whereas, it was decreased in the thalamus and increased in the SCP in MSA vs. PSP (66). Using a machine learning algorithm, combined analysis of free-water and free-water-corrected FA derived from selective regions-of-interest achieved excellent separation among PD, MSA, and PSP cases (66). Unsupervised machine learning-based classification of PD, MSA-P and MSA-C patients using multimodal neuroimaging measures (GM density, T2* relaxation rate, and DTI) have also been pursued with favorable results (119). Free-water imaging using advanced diffusion models may become an effective tool in the differential diagnosis of parkinsonian disorders in the future.
Proton Magnetic Resonance Spectroscopy in MSA
Compared to controls, NAA/Cr ratios were smaller in the putamen in MSA-P, and in the pontine base in both MSA-P and MSA-C cases (120). Lower NAA/Cr ratios in the putamen and pontine base best discriminated MSA-P cases from PD (120). In another study, no significant differences were observed in the metabolites examined between MSA-P and PD, suggesting similar metabolic alterations in the two disorders (71). Likewise, cerebellar NAA/Cr and NAA/myo-inositol levels in MSA-P subjects were similar to those seen in PD (77). In MSA-C patients, cerebellar NAA/Cr and NAA/myo-inositol ratios were significantly reduced compared to PD, MSA-P, PSP-Richardson's syndrome (PSP-RS), and controls, whereas cerebellar myo-inositol/Cr ratios were elevated in MSA-C compared to controls (77).
Progressive Supranuclear Palsy (PSP)
Magnetic Resonance Imaging in PSP
Structural MRI typically shows atrophy of the midbrain and SCP in PSP compared to PD, MSA-P, CBD/CBS and controls (121–124). Several morphological markers suggestive of PSP on MRI have been reported, including midbrain atrophy compared to pons (“hummingbird” sign; specificity ~99.5%, sensitivity ~51%; Figure 5), atrophy of the midbrain tegmentum (“morning glory” sign, specificity ~97%, sensitivity ~37%; visualized as concavity of the lateral margins of the midbrain tegmentum on axial images; Figure 5) (125–127), midbrain T2 hyperintensity, as well as atrophy of the midbrain tegmentum with relative preservation of the midbrain tectum and cerebral peduncles (“mickey mouse” sign, visualized as rounded rather than rectangular midbrain peduncles on axial images) (99, 125). Importantly, the “hummingbird” and “morning glory” signs had high specificity but low sensitivity (99). Furthermore, image acquisition parameters may influence the appearance of these morphological features (4).
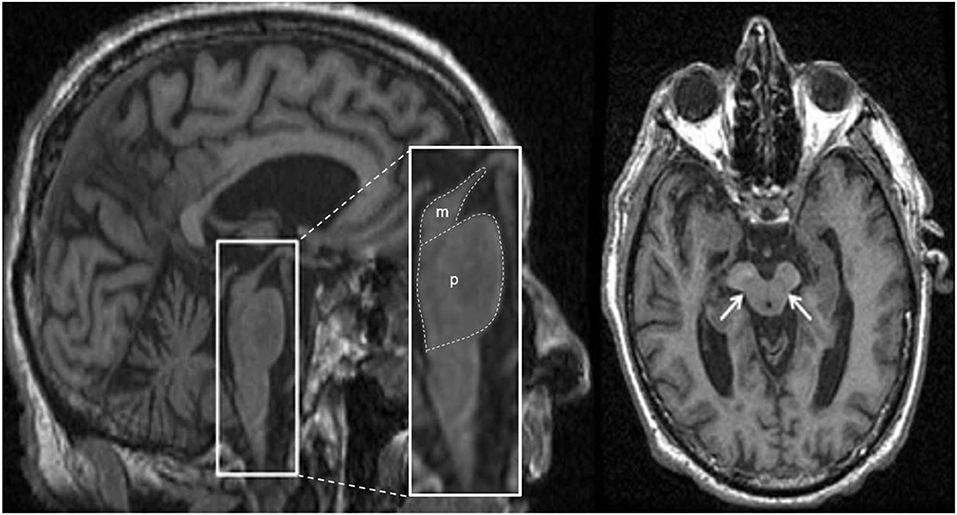
Figure 5. Magnetic resonance imaging of a patient clinically-diagnosed with progressive supranuclear palsy. The left image is a sagittal T1-weighted sequence showing the “hummingbird” sign (smaller box), while the right image is an axial T1-weighted sequence showing the “morning glory” sign (arrows); both features are seen in progressive supranuclear palsy. The pons (p) and midbrain (m) areas are also shown (larger box), and their ratios have been used to calculate an index to assist in the diagnosis (128). Figure adapted from Saeed et al. (10), under the Creative Commons Attribution License 4.0 (https://creativecommons.org/licenses/by/4.0/).
In PSP vs. controls, reduced volumes were reported in the brainstem, midbrain, and frontal GM (129), however, only the midbrain volume showed minimal overlap with the normal range on a case by case basis (129). In PSP-RS, atrophy of the midbrain was the predominant feature (4, 130). In a pathology-proven sample, atrophy of the midbrain and SCP was associated with PSP, whereas frontoparietal and pallidum degeneration in the absence of significant brainstem atrophy was suggestive of CBD (123). The premotor cortices and supplementary motor area were involved in both PSP and CBD cases (123). Besides midbrain atrophy, VBM studies also show degeneration in the subcortical structures including pons, thalamus and striatum, as well as widespread cortical atrophy in the frontal, prefrontal, insular, premotor and supplementary motor areas vs. controls (121, 131, 132). Moreover, WM degeneration was reported in the pulvinar, dorsomedial and anterior nuclei of the thalamus, superior and inferior colliculi, as well as in the mesencephalic, and frontotemporal regions (131, 132). Pontine atrophy rates were significantly slower in PSP vs. MSA-P, and rates in the frontal lobe and midbrain in PSP were associated with executive and motor impairment, respectively (133). The midbrain atrophy rate may serve as an effective outcome measure in PSP clinical trials (134). In addition, the support vector machine classification method yielded accuracy rates >80% for predicting PSP diagnosis using disease-specific regions-of-interest (pallidum, putamen, caudate nucleus, thalamus, midbrain and insula) compared to the whole-brain approach (135).
Predominant midbrain atrophy has been incorporated as a supportive imaging feature in the Movement Disorders Society's PSP diagnostic criteria (3). The ratios of the pons to midbrain area (P/M) (as shown in Figure 5) and MCP to SCP widths (MCP/SCP) were found to be larger in PSP compared to PD, MSA-P and controls (specificity and sensitivity, 100%) (128, 136). Using these ratios, an index was calculated as [(P/M) x (MCP/SCP)], termed the “magnetic resonance parkinsonism index,” which proved to be highly sensitive and specific for distinguishing PSP from PD, MSA-P and controls (128). A revised version incorporating the width of the third ventricle has been proposed [“magnetic resonance parkinsonism index” × (third ventricle width)/(frontal horns width)], which showed superior sensitivity (100%) and specificity (94.3%) in differentiating PSP-parkinsonism patients with slowness of vertical saccades from PD (137). It is important to recognize that midbrain atrophy may not be evident in all PSP subtypes and thus, atrophy patterns from other brain regions (such as the globus pallidus, frontal lobe, and cerebral peduncle) may provide additional information (138). It is unknown whether the above quantitative measures can distinguish PSP patients at early disease stages, or whether PSP subtypes with less pronounced midbrain atrophy can be distinguished, which provides impetus for further research.
Diffusion-Weighted and Diffusion Tensor Imaging in PSP
Compared to controls, diffusion imaging studies in PSP show variable findings and may reveal the following: increased D or decreased FA in the decussation of SCP, orbitofrontal WM, thalamus, cingulum, motor and supplementary motor area, as well as in the inferior fronto-occipital fasciculus, superior longitudinal fasciculus, anterior corpus callosum, arcuate fasciculus, posterior thalamic radiations, and internal capsule (115, 132, 139, 140). Elevated ADC values were observed in the putamen in PSP vs. controls over a 2 year period (141). Increased D in the decussation of SCP may discriminate PSP from MSA and PD (115), whereas increased ADC values in the putamen, globus pallidus and caudate nucleus may help distinguish PSP cases from PD (142). Another study calculated the FA score per subject for regions hypothesized to be involved in PSP (i.e., the SCP and frontal WM region), and reported >85% sensitivity and specificity for differentiating PSP from PD/DLB cases (143).
A multimodal study integrated volumetric MRI, DTI and neuromelanin-sensitive imaging, and identified several predictors for separating PSP-RS from controls (144). The best predictor was the neuromelanin-based SN volume followed by FA in the midbrain (144). The separation of PSP-RS cases from PD was achieved using neuromelanin-based SN volume, pons FA values, midbrain and globus pallidus volumes, and basal forebrain FA values (144). Another study identified greater atrophy, decreased FA, and increased D in the SCPs bilaterally in PSP-RS patients as compared to PD and controls (145). More advanced neuroimaging techniques have identified changes in the free water in the posterior SN (118). Specifically, free-water values derived from the bi-tensor diffusion model were significantly elevated in PSP in the posterior SN vs. MSA, PD and controls, and were observed in a characteristic pattern: PSP > MSA/PD > HC (118). In addition, free-water-corrected FA was elevated in PSP in the caudate, putamen, thalamus and vermis with accompanying decreases seen in the SCP and corpus callosum compared to controls (66).
Other studies have compared diffusion imaging parameters in PSP subtypes. Lower FA values were exclusively detected in the SCP in PSP-RS vs. PSP-parkinsonism patients, implicating SCP's involvement in postural instability (146). PSP patients with vertical supranuclear gaze palsy exhibited lower FA values in the midbrain vs. those with slowness of vertical saccades, highlighting the role of midbrain atrophy in vertical ocular dysfunction (146). PSP-RS patients also showed more severe and widespread diffusion abnormalities vs. PD, which reflects greater microstructural damage as consistent with greater overall brain atrophy often found in PSP-RS than in PD cases (147). Moreover, damage to the SCPs may be detected in both PSP-RS and PSP-parkinsonism subtypes (130, 145). When the two subtypes were directly compared, PSP-RS patients showed decreased FA and increased D in the left SCP vs. PSP-parkinsonism patients (145). Computer-aided diagnosis of PSP and its subtypes may be possible using diffusion-weighted/DTI measures (145, 147).
Proton Magnetic Resonance Spectroscopy in PSP
In PSP, reductions in the NAA/Cr ratios in the LN, brainstem, centrum semiovale, frontal, and precentral cortex, as well as reductions in the NAA/choline values in the LN are observed relative to controls (148, 149). A more prominent decline in NAA/Cr ratio was noted in the putamen vs. PD and MSA (150). PSP-RS patients had reduced cerebellar NAA/Cr and NAA/myo-inositol ratios vs. controls, and reduced cerebellar NAA/Cr ratio vs. PD patients (77). Compared to controls, PSP patients also showed a decrease in scyllo-inositol concentration (a stereoisomer of inositol) and scyllo-inositol/Cr ratio in the supplementary motor area, and both of these metabolic measures were directly related to attention and working memory functions (151). The pathological significance of scyllo-inositol reduction in PSP is currently uncertain (151).
Corticobasal Degeneration/Syndrome (CBD/CBS)
Magnetic Resonance Imaging in CBD/CBS
In CBS/CBD, asymmetrical cortical atrophy in the frontoparietal lobe is commonly observed (Figure 6), contralateral to the clinically more affected side of the body (however, laterality may not be present in all cases). In CBS vs. controls, an asymmetric pattern of atrophy in the bilateral premotor cortex, superior parietal lobules, and striatum was identified (121). Compared to PSP, greater atrophy was observed in the dorsofrontal and parietal cortices in CBS (121, 129), whereas midbrain atrophy was more pronounced in PSP vs. CBS (121). Likewise, greater asymmetric GM degeneration in the inferior frontal and premotor cortex, parietal operculum, superior temporal gyrus, and hippocampus was detected, along with decline in FA primarily in the frontoparietal region vs. controls (152). In a meta-analysis of VBM studies, although a significant overlap was detected among PSP, MSA-P, and CBS cases, more prominent atrophy in the superior parietal lobe was observed in CBS (153). Importantly, CBS can be associated with significant pathological heterogeneity difficult to predict based on clinical presentation in life (15, 154). Thus, neuroimaging patterns using pathology-proven samples can improve diagnostic accuracy.
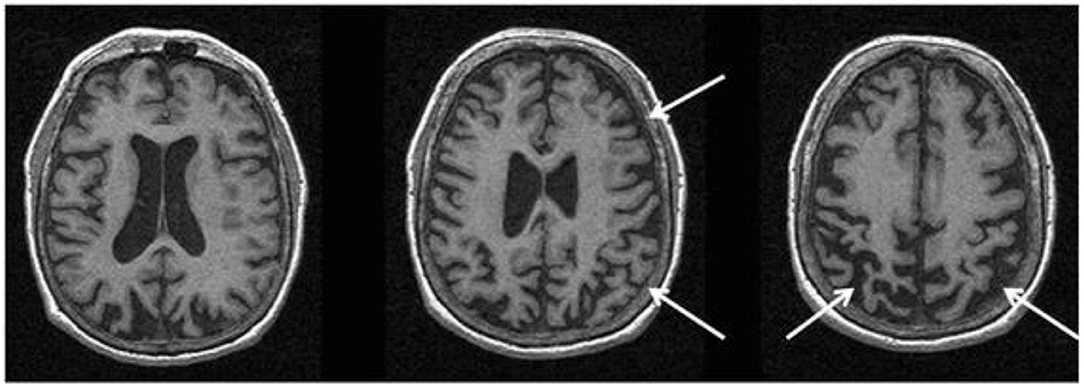
Figure 6. Magnetic resonance imaging of a patient with a pathology-proven diagnosis of corticobasal degeneration. Serial axial T1-weighted sequences are presented showing right greater than left parietofrontal atrophy commonly seen in corticobasal syndrome. Figure reproduced from Saeed et al. (10), under the Creative Commons Attribution License 4.0 (https://creativecommons.org/licenses/by/4.0/).
On MRI, the pattern of atrophy in CBS aligns with the “true” underlying pathology. Although, GM atrophy in a clinically-diagnosed CBS group was observed in the premotor cortices, supplemental motor area and insula, the pattern of atrophy aligned more closely with neuropathological diagnosis (155). For example, frontotemporal atrophy in CBS was associated with frontotemporal lobar degeneration with transactive response DNA binding protein-43 kDa (TDP-43) pathology, whereas temporoparietal atrophy was related to AD pathology (155). In contrast, focal atrophy predominantly involving the premotor cortex and supplementary motor area was observed in those pathologically diagnosed with CBD and PSP, although more severe changes in these regions suggested CBD over PSP (155). The degree of gross global atrophy is typically more severe in CBD vs. PSP (156). Another pathology-confirmed study observed GM degeneration in the dorsal prefrontal and perirolandic cortex, striatum, and brainstem in CBD vs. controls (6). Furthermore, in CBS due to frontotemporal lobar degeneration (tau or TDP-43), atrophy pattern progressed into the prefrontal cortex, striatum and brainstem, while in CBS due to AD, atrophy stretched into the temporoparietal cortex and precuneus regions (6). The predominant clinical syndrome in CBS (extrapyramidal vs. cognitive) was associated closely to the regional atrophy patterns (123). On fluid-attenuated inversion recovery images, subcortical WM hyperintensities with ventricular dilation (greater in the more affected lobe) were reported (157), however, these changes are not specific to CBS/CBD.
Diffusion-Weighted and Diffusion Tensor Imaging in CBD/CBS
Elevated D and reduced FA were detected in the posterior truncus of the corpus callosum in CBS compared to PD and controls suggesting transcallosal fiber degeneration (59). In addition to the corpus callosum (59, 152, 158), decreased FA in CBS was observed in the long frontoparietal connecting tracts, intraparietal associative fibers, and sensorimotor cortical projections (152). Similarly, reduced FA and increased D were noted in the WM of premotor, prefrontal and motor cortices, as well as in the middle cingulate bundle vs. controls—changes that were more pronounced contralateral to the more affected side (158). Compared to PSP, a more asymmetric, supratentorial and posterior pattern of WM tract degeneration was reported in CBS with greater involvement of the splenium of the corpus callosum, WM of the motor and premotor cortices, as well as the parietal lobes (158).
Proton Magnetic Resonance Spectroscopy in CBD/CBS
NAA/Choline and NAA/Cr levels were reduced in CBS patients in the frontoparietal cortex, LN and centrum semiovale vs. controls (149, 159). Lower NAA/Choline levels in the frontoparietal lobe may help differentiate CBS cases from PSP (149). In the parietal cortex of CBS patients, the NAA/Choline values were reduced contralateral to the clinically more affected side (159). A more pronounced reduction in NAA/Cr values was observed in the frontal cortex and putamen vs. PD, MSA and vascular parkinsonism, with prominent asymmetry in NAA/Cr ratios in the putamen (150). Lower putaminal NAA levels have been reported across the PD, MSA, PSP and CBS patients to varying degrees. Thus, laterality of metabolite ratios observed in the putamen in CBS may be helpful in differentiation in some cases.
Functional Magnetic Resonance Imaging in Parkinsonian Disorders
Using resting-state and task-based functional MRI, several large-scale networks involved in motor, cognitive, and affective processes have been identified (Table 3). Impairments in these networks as well as in specific circuits (e.g., basal ganglia thalamocortical circuit and cortical-subcortical sensorimotor circuit) have been associated with motor and non-motor symptoms in PD and atypical PS. Reduced resting-state functional connectivity between the striatum and the thalamus, midbrain, pons and cerebellum was observed in PD, highlighting connectivity alterations within the brainstem (160). Within the striatum, a greater change in connectivity was evident in the posterior putamen, followed by the anterior putamen and caudate (160) as consistent with the patterns of striatal dopaminergic dysfunction in PD (161–163). Connectivity changes between the striatum and sensorimotor and visual cortical areas as well as the supramarginal gyrus were also evident (160) probably highlighting dysfunction of the cortical-subcortical sensorimotor circuit in PD (164). Furthermore, reduced resting-state functional connectivity within the basal ganglia network allowed differentiation of PD cases in the drug-off state from controls (sensitivity 100%, specificity 89.5%) (165). Conversely, increased functional connectivity was detected in associative and limbic connections in PD likely indicating compensatory changes due to dopaminergic deficits and the ensuing alterations in related circuits (164).
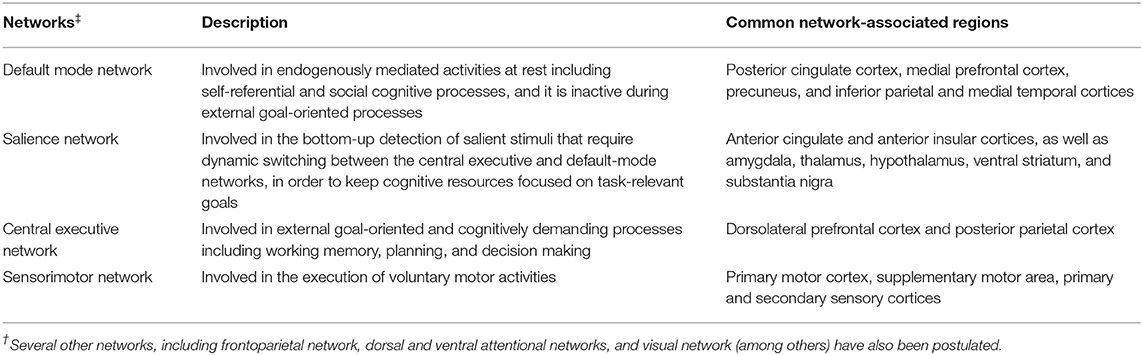
Table 3. An overview of 4 core brain networks.
In tremor-dominant PD, the globus pallidus internus and putamen exhibited elevated functional connectivity with the cerebellothalamic circuit that modulates tremor amplitude. It was suggested that basal ganglia degeneration (and the resulting dopamine deficiency) can cause tremors by disrupting cerebellothalamic circuit signaling (166). PD patients with freezing of gait showed abnormal functional connectivity in the pedunculopontine nucleus, which primarily affected the corticopontine-cerebellar pathways and visual temporal areas involved in visual processing (167). These findings are consistent with observations seen in DTI structural connectivity studies (168). Furthermore, PD patients with sleep disturbance showed changes in cortical functional connectivity within the default mode network, central executive network, and dorsal attention network vs. PD patients without sleep disturbance (169). Hallucinations in PD were found to be associated with functional connectivity changes within the default mode network and visual processing areas implicating networks involved in perceptual and attentional processing (170).
Compared to PD, patients with MSA displayed reduced cerebellar connectivity within multiple brain networks as well as the striatum (171). Overlap in functional connectivity was noted in PD and PSP patients within the thalamus, striatum, and prefrontal cortex, however, not surprisingly, the PSP group showed more extensive functional connectivity disruptions throughout the brain (particularly in the midbrain, precentral gyrus, parietal cortex, basal ganglia, and cerebellum) (172). Another study identified deficits in the resting-state functional connectivity in PSP cases in the rostral midbrain tegmentum network (173). In CBS, decreased functional connectivity was reported in the right central operculum, middle temporal gyrus, and posterior insula, whereas an increase in connectivity was identified in the anterior cingulum, medial superior frontal gyrus, and bilateral caudate nuclei (174). Thalamic functional connectivity was decreased in both PSP and CBS groups in multiple cortical, subcortical, and cerebellar regions (175). In contrast, whole brain functional connectivity of the dentate nucleus differed between PSP and CBS: it was reduced in the subcortical and prefrontal cortical areas in PSP, whereas it increased asymmetrically in the frontal cortex in CBS (175).
In a longitudinal task-based functional MRI study that incorporated a motor control paradigm, a decline in activity within the putamen and primary motor cortex was identified over 1 year in PD patients vs. controls (176). Conversely, a more widespread and unique pattern of functional changes were observed in MSA and PSP patients compared to PD. In MSA, changes were exclusively extrastriatal (i.e., the primary motor cortex, supplementary motor area and superior cerebellum) (176). In PSP, all regions-of-interest were less active at 1 year compared to baseline, including the contralateral putamen, ipsilateral putamen, contralateral primary motor cortex, contralateral supplementary motor area, and ipsilateral superior cerebellum (176).
Changes in functional connectivity after symptomatic treatment interventions have also been observed. For example, increase in functional connectivity was identified in the supplementary motor area (part of the sensorimotor resting-state network) after levodopa administration in drug-naïve PD patients (177). The sensorimotor system was suggested to be one of the targets of acute levodopa treatment (177). Likewise, the administration of dopaminergic medication resulted in enhanced connectivity within the basal ganglia network (165). Finally, repetitive transcranial magnetic stimulation can improve motor symptomatology by influencing functional hubs connecting to motor-related networks, including the default mode, cerebellar, and limbic networks (178).
Transcranial B-Mode Sonographic Imaging in Parkinsonian Disorders
Echogenicity in Substantia Nigra
In PD, increased echogenicity of the SN is commonly observed, which can be visualized at the mesencephalic plane as an enlarged, lighter (i.e., mildly echogenic) region within the darker mesencephalon (179–182) (Figure 7). Similar to idiopathic PD, increased SN echogenicity is seen in PD patients carrying LRRK2 and GBA mutations (183). Although, the precise etiology of SN hyperechogenicity is under research, it is likely due to the known nigral pathology and associated accumulation of free (unbound) iron within the SN.
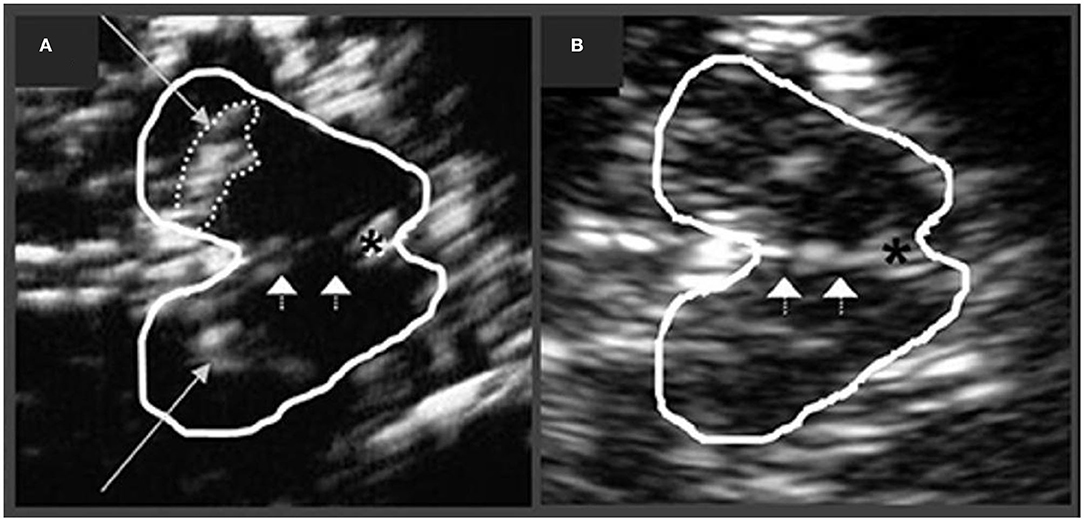
Figure 7. Transcranial sonographic image outlining the butterfly-shaped midbrain at the mesencephalic plane. In (A), enlarged area of echogenicity at the anatomical site of substantia nigra (long arrows) is depicted, as may be seen in Parkinson's disease patients. In addition, interrupted echogenic line of the raphe can be observed (short arrows). In (B), normal midbrain echogenicity is shown. The aqueduct is indicated by an asterisk. Figure adapted from Richter et al. (182), under the Creative Commons Attribution License (https://creativecommons.org/licenses/by/4.0/).
SN hyperechogenicity may be present in preclinical stages as detected in those with increased risk of PD, e.g., individuals with a family history of PD (184). The area of SN hyperechogenicity remained stable in PD over a 5 year period (185) suggesting that this feature may be considered an early “trait” marker of vulnerability, as opposed to a marker of progression in PD. Indeed, studies have not consistently shown a correlation between SN hyperechogenicity and disease severity or duration (181, 186–188). Likewise, no correlation has been observed between SN hyperechogenicity and the degree of presynaptic DAT loss in PD (189). SN hyperechogenicity may not differ based on PD laterality and has been observed in both hemispheres, irrespective of the clinically affected side (187).
It is also important to note that ~10% of healthy controls, as well as ~16% of patients with essential tremor may show elevated echogenicity in the SN (190), thus limiting the utility of this “echofeature” as a standalone biomarker of PD. For example, in a 3 year longitudinal study, baseline SN hyperechogenicity was evident not only in PD, but also in patients with essential tremor, who subsequently developed parkinsonian symptoms during the follow-up period (191).
Increased echogenicity of the SN, particularly when marked, has been reported to differentiate PD cases from atypical PS (PSP and MSA as a group) with good sensitivity (~91%) and specificity (~82–96%) (179, 192). When experienced examiners are available, this technique can be resourceful in differentiating PD from atypical PS. However, patients with DLB and PDD also present with hyperechogenic SN in frequencies similar to those in PD. For example, ~80% of DLB cases showed hyperechogenic SN bilaterally, and thus the differential diagnosis in PDD/DLB relies upon other clinical features and diagnostic biomarkers (193). Nevertheless, it is suggested that the discrimination between DLB and PDD using transcranial sonography may be made by combining SN echogenic sizes, asymmetry indices, and onset age (sensitivity 96%, specificity 80%) (193). Hyperechogenic SN can also be seen in CBS (~60–80%) and PSP disorders [~10–20%, especially in PSP-parkinsonism subtype (194)]; however, studies in CBS and PSP are limited by small sample sizes and lack of neuropathological confirmation (195–197).
Echogenicity of the Lentiform Nucleus
Increased echogenicity of the LN is a feature noted in some atypical PS and may be of diagnostic utility when examined together with SN echogenicity. In healthy individuals, the LN is visualized as an isoechogenic structure, located between the caudate nucleus and thalamus. Hyperechogenic LN may support a diagnosis of atypical PS when seen together with normoechogenic SN (188). Specifically, this echogenic profile was observed in MSA-P and PSP patients with good sensitivity (100%), albeit with a low specificity (~59%). Normal echogenicity of the SN alone aligned with a diagnosis of MSA-P (sensitivity 90%, specificity 98%), while increased echogenicity of the LN alone was unhelpful in the differential diagnosis of parkinsonian syndromes since PD and PSP patients may show this feature to some degree (197). Enlargement of the third ventricle can also be examined using transcranial sonography. Ventricular enlargement >10 mm together with LN hyperechogenicity may indicate PSP (197), whereas normal LN echogenicity was observed in CBS patients (195). Given the considerable heterogeneity evident in atypical PS, more studies are needed to develop reliable sonographic profiles of these disorders.
Spect and Pet Imaging of the Dopaminergic System in Parkinsonian Disorders
Presynaptic Dopamine Transporter (DAT)
Normal DAT binding on 123I-FP-CIT SPECT can be visualized as two bright symmetric “comma-shaped” regions, signifying intense activity in the striatum (striatum includes caudate nucleus and putamen; Figure 2). Any change in this activity on 123I-FP-CIT SPECT may indicate presynaptic nigrostriatal injury (198, 199). Overall, DAT SPECT shows normal presynaptic nigrostriatal activity in normal individuals, essential tremor cases, and in drug-induced or psychogenic/functional parkinsonism (200–202).
Conversely, reduced DAT binding on SPECT has been observed in PD, DLB/PDD, MSA, and PSP patients to varying degrees suggesting nigrostriatal degeneration (200, 203–205). The utility of DAT SPECT in differentiating PD in early stages from normal subjects and cases with essential tremor and vascular parkinsonism with high accuracy has been suggested (206). In PD, the posterior putamen exhibits earlier and more severe reduction in activity compared to the anterior putamen or caudate nucleus (161). The decline in DAT signal is often more pronounced in the hemisphere contralateral to parkinsonian symptomatology, whereas binding may appear symmetric in cases with symmetric motor deficits (161). Striatal DAT SPECT binding has been shown to correlate with PD severity and motor impairment (202, 207–209). Reduced DAT binding can differentiate patients with PD and DLB from AD (210, 211). In a recent population-based study, striatal DAT deficits (particularly in the caudate nucleus) were associated with shorter survival in PD patients (212).
Similar to SPECT, 18F-dopa PET studies evaluating the presynaptic nigrostriatal dopaminergic system have found reduced radiotracer uptake in PD, MSA-P, PSP and DLB groups vs. controls, whereas normal uptake was observed in cases with essential tremor (205, 213). Specifically, 18F-dopa PET measures the activity of aromatic amino acid decarboxylase (AADC) enzyme, which converts 18F-dopa into 18F-dopamine, providing an approximation of dopaminergic storage levels. In PD, decreased 18F-dopa uptake was first evident in the posterior putamen, followed by anterior putamen and caudate nucleus, contralateral to the clinically affected side (162, 163). Striatal and putaminal 18F-dopa uptake have been shown to associate with PD progression and motor severity, respectively (163). Other PET radiotracers, such as 11C-DTBZ, can be used to evaluate the presynaptic monoaminergic system by labeling the vesicular monoamine transporter type 2 (VMAT2)—a presynaptic transmembrane protein essential for packaging and storing monoamines (including dopamine) in synaptic vesicles. Reduced VMAT2 binding in the striatum was detected in PD on 11C-DTBZ PET (214). As identified in 18F-dopa PET, the greatest regional decrease in VMAT2 binding in PD (using 18F-AV-133) was observed in the posterior putamen, followed by the anterior putamen and caudate nucleus (215). Notably, due to ongoing compensatory changes in response to neurodegeneration (AADC upregulation, presynaptic DAT down-regulation), the nigrostriatal presynaptic dopaminergic injury may be underestimated using PET and SPECT imaging (214). Furthermore, an approximated 10–20% of clinically diagnosed PD cases that were enrolled in neuroprotective trials of PD and underwent DAT imaging presented with “scans without evidence of dopaminergic deficit” (216). Studies have shown this group of cases to be quite heterogeneous and [among other reasons (10)] represent a clinical misdiagnosis of PD in most cases (10, 216). Reduced DAT binding using 11C-methylphenidate PET has also been identified in clinically-unaffected mutation carriers of LRRK2 gene associated with dominant inheritance of PD (217). Elevated dopamine turnover in the putamen was suggested to be an even more sensitive subclinical indicator of PD in LRRK2 mutation carriers compared with reduced dopaminergic terminal integrity as assessed by VMAT2 and DAT binding (218).
DAT SPECT imaging can be invaluable in differentiating DLB from other forms of dementia (219). For example, an abnormal DAT scan can enhance the diagnostic certainty of DLB from “possible” to “probable” (220), and assist in differentiating DLB without clinically significant parkinsonism from AD (221–223). The development of parkinsonism over 6 months was associated with abnormal baseline 123I-FP-CIT SPECT scan in possible DLB patients (224). Although, an abnormal DAT scan supports the diagnosis of DLB, a normal scan does not exclude DLB altogether, including those cases that present with minimal brainstem involvement (223).
In MSA-P, signal loss on DAT SPECT was greater over time in the caudate and anterior putamen vs. PD, as consistent with a relatively faster rate of disease progression in MSA-P (225). Patients with CBS may show striatal DAT SPECT reduction with greater hemispheric asymmetry vs. PD (226, 227). Furthermore, patients with CBS/CBD may show normal nigrostriatal DAT SPECT scans, especially early in the course of the disease, suggesting that nigrostriatal degeneration may be a late pathological feature of CBD (228). Patients with PSP tend to exhibit more pronounced but fairly uniform DAT loss in the striatum (204). In contrast to PD, a relatively uniform involvement of presynaptic striatal dopaminergic neurons was observed in PSP, as evidenced by lower striatal-to-occipital but higher putamen-to-caudate DAT binding ratios (229, 230). Likewise, a more symmetric pattern of DAT loss was detected in PSP vs. PD and MSA-P (202, 229, 230), with the index of asymmetry significantly greater in PD relative to PSP (230). A recent meta-analysis further confirmed reduced DAT activity in the caudate nucleus and putamen in PSP vs. PD and MSA-P, and in MSA-P vs. MSA-C (231). Investigations using 18F-dopa PET mirror these SPECT-based findings as follows: putaminal uptake was significantly lower in atypical PS and PD vs. controls (232–234). However, a more severe decline was noted in the caudate head in atypical PS vs. PD (234). As compared to PD, putamen and caudate regions were equally abnormal in PSP (232). Despite these findings, the presynaptic striatal binding patterns using PET and SPECT are currently unreliable in differentiating parkinsonian disorders on a case-by-case basis. Finally, using 99mTc-TRODAT-1 SPECT, lower putaminal DAT uptake was associated with shorter time of conversion from idiopathic RBD diagnosis to an α-synucleinopathy vs. those with higher putaminal DAT uptake (235). This may suggest a predictive role of nigrostriatal damage in idiopathic RBD in terms of conversion to an α-synucleinopathy (235). However, an abnormal DAT scan was found to be less sensitive than motor features in predicting phenoconversion from idiopathic RBD to overt neurodegenerative syndrome (of PD, LBSD, and MSA) (236).
Postsynaptic Dopamine D2 Receptor
In drug-naïve PD patients compared to controls, binding potential for the G-protein-coupled dopamine D2 receptors measured using 11C-raclopride PET may appear normal or upregulated contralateral to the clinically affected side (237–239). Similarly, striatal dopamine D2 receptor upregulation was observed in drug-naïve PD patients using SPECT ligands (123I-IBZM and 123I-IBF) probably suggesting compensatory changes secondary to nigrostriatal denervation, with higher upregulation detected in the posterior putamen (161, 240). In medicated PD cases, postsynaptic D2 receptor binding was reduced or within the normal range compared to controls in PET and SPECT studies (161, 200, 237, 241). Normal D2 binding potential was also observed in patients with DLB and essential tremor (161, 200), while reductions were reported in atypical PS cases (239).
In PSP vs. controls, reduced D2 receptor binding was detected in PET and SPECT studies (200, 239, 242). Likewise, D2 binding reductions were noted in MSA patients compared to PD (233, 241) and controls (200, 233, 241, 242) correlating with striatal glucose hypometabolism (241). In CBS, studies typically show preservation of postsynaptic D2 receptors, although inconsistently, which is not surprising given the pathologic heterogeneity evident in this disorder (200, 203, 243).
The posterior putamen to caudate binding ratios were >1 in almost all drug-naïve and medicated PD and PSP cases (161). In contrast, this ratio was <1 in most MSA cases indicating greater loss of D2 receptors in the posterior putamen in MSA (161). This finding is consistent with a 11C-raclopride PET study, whereby elevated caudate-to-putamen and anterior-to-posterior putamen D2 receptor binding ratios were observed in MSA-P vs. PD suggesting greater D2 receptor loss in the posterior putamen in MSA-P cases (244).
Combining SPECT-based presynaptic DAT and postsynaptic D2 receptor imaging may improve diagnostic capacity (245). For example, a study suggested increased accuracy in differentiating PD from atypical PS using a multidimensional combination of striatal presynaptic DAT imaging, postsynaptic D2 receptor imaging, and myocardial scintigraphy [evaluates cardiac postganglionic sympathetic fiber function, which is significantly impaired in early PD and LBSD, as reviewed in (10)] (246). Further studies with pathology proven samples are needed to improve the utility of postsynaptic D2 receptor imaging in differentiating parkinsonian disorders.
Spect Imaging of Cerebral Perfusion in Parkinsonian Disorders
Cerebral perfusion SPECT evaluates the metabolic status of brain tissue by quantifying changes in the regional cerebral blood flow using various radiotracers (Table 2). Occipital hypoperfusion is frequently observed in DLB, however, it may not be present in all cases on an individual basis. When present, it should raise the possibility of DLB as the underlying cause of the disease. Using 99mTc-HMPAO as a radiotracer, temporoparietal hypoperfusion was detected in both AD and DLB cases to varying degrees vs. controls, whereas occipital hypoperfusion was the differentiating feature in DLB vs. AD (247). Occipital hypoperfusion has also been detected using other SPECT radiotracers (e.g., 123I-IMP and 99mTc-ECD). Perfusion SPECT was unable to differentiate PDD cases from DLB, revealing similar perfusion profiles in some studies (248, 249). In addition, hypoperfusion in the left occipital region along with worse episodic memory performance was found to distinguish DLB patients without visual hallucinations from CBS at earlier disease stages (250).
Patients with CBS tend to show asymmetric perfusion profiles (251, 252), however, asymmetry may not be observed in all cases. Compared to PSP (using 123I-IMP tracer), asymmetrically reduced perfusion was noted in CBS in the inferior prefrontal, sensorimotor, and posterior parietal cortices, with overlap in the medial frontal region (252). Perfusion asymmetry may serve as a supportive feature when differentiating CBS from other atypical PS patients. The differentiation of LBSD from atypical PS may be feasible using an automated image-based classification system, which incorporates striatal DAT uptake and regional perfusion patterns (253).
Hypoperfusion in the occipital cortex using SPECT has also been seen in PD vs. controls (249, 254), whereas frontal lobe hypoperfusion was present in both PD and MSA-P patients (254). Hypoperfusion in the frontal lobe was observed in a 1 year longitudinal study in PD (255). In MSA-P cases, hypoperfusion in the putamen was noted compared to that in PD (256), whereas hypoperfusion together with local cerebral atrophy was found in the cerebellum and pons in MSA-C patients vs. controls (257). The current literature on perfusion SPECT is limited by lack of pathology-confirmed investigations, small sample sizes, and a handful of studies in MSA, PSP, and CBS. Moreover, given the overlap in perfusion profiles, other techniques (e.g., 123I-metaiodobenzylguanidine myocardial scintigraphy or DAT imaging) may perform superior to perfusion SPECT in some cases (258). Multimodal imaging can provide valuable diagnostic information in uncertain cases (10).
Pet Imaging of Glucose Metabolism in Parkinsonian Disorders
Metabolic Patterns Using Regional and Voxel-Based Analyses
Cerebral glucose metabolism can be evaluated using 18F-labeled fluorodeoxyglucose [18F-FDG] where reduced tracer uptake is indicative of lower glucose utilization by the tissue. Normal metabolism or hypermetabolism involving the LN (which includes putamen and globus pallidus) and possibly the thalamus, motor cortex, and cerebellum may be observed in PD on 18F-FDG-PET, whereas hypometabolism may be seen in parieto-occipital association areas and in the dorsolateral prefrontal cortex (259, 260). Preserved glucose metabolism in the basal ganglia may differentiate PD from MSA and PSP, where a corresponding glucose hypometabolism is typically seen in the latter (259). A meta-analysis found decreased glucose metabolism in the bilateral inferior parietal cortex and left caudate nucleus in PD, which was linked to cognitive deficits and motor symptoms, respectively (261). In MSA, glucose hypometabolism may be observed in the putamen and brainstem, with or without hypometabolism in the cerebellum compared to PD and controls (259, 262). Glucose hypometabolism may be more predominant in the bilateral putamen in MSA-P and bilateral cerebellum in MSA-C (263), based on the most affected regions in these disorders. In addition, microstructural damage as assessed using DTI was found to be associated with glucose hypometabolism in the posterior putamen in MSA-P patients (264).
In PSP, glucose hypometabolism was evident in the caudate/basal ganglia, midbrain, thalamus, as well as anterior cingulate, frontal and primary motor cortices vs. controls (259, 263, 265). Midbrain hypometabolism visualized as an oval or round region on 18F-FDG-PET was identified in PSP as compared to MSA and CBS patients (specificity 100%, sensitivity 29%), and may reflect midbrain atrophy (266). Compared to PD, MSA, and controls, glucose hypometabolism in PSP was reported in the caudate nucleus, thalamus, midbrain, and cingulate gyrus (262). In CBS, an asymmetric glucose hypometabolism in the basal ganglia and frontoparietal cortices may be apparent, contralateral to the clinically more affected side (263, 267). Hypometabolism in the parietal lobe may help discriminate CBS patients from PSP (268).
Patients with PDD and DLB often show a similar pattern of bilateral glucose hypometabolism vs. controls in the posterior cortical areas, including lateral frontal, temporoparietal, and occipital regions (269, 270). A more prominent hypometabolism in the anterior cingulate cortex may distinguish DLB from PDD (270). Occipital hypometabolism combined with less prominent metabolic decline in the medial temporal lobe (particularly the hippocampus) may be useful in differentiating DLB/PDD from AD (269). When differentiating DLB from AD, hypometabolism in the lateral occipital cortex achieved the highest sensitivity (88%), while relatively preserved metabolism in the posterior cingulate cortex (“cingulate island” sign) attained the highest sensitivity (100%) (271). It is suggested that 18F-FDG-PET may perform superior to 123I-IBZM-SPECT for discriminating Lewy body disorders from atypical PS (272). Moreover, computer-assisted interpretation of FDG-PET data may be used for objective evaluation in parkinsonian disorders, which can provide accuracy equivalent to visual reading especially in places where skilled readers are not available (260).
Metabolic Patterns Based on Spatial Covariance Analysis
The spatial covariance analysis on resting-state 18F-FDG-PET data has enabled the identification of disease-related metabolic patterns in PD and atypical PS. In PD, a specific and relatively stable PD-related motor pattern (PDRP) and PD-related cognitive pattern (PDCP) have been identified. The PDRP is characterized by elevated pallidothalamic and pontine metabolic activity associated with reduction in the supplementary motor area, premotor cortex, and parietal association areas (273). The expression level of PDRP correlated with the loss of presynaptic nigrostriatal dopaminergic integrity and motor dysfunction (274, 275), and was also elevated in patients with idiopathic RBD (276). Likewise, the PDCP pattern was characterized by metabolic reduction in the medial frontal and parietal association regions, and metabolic increase in cerebellar cortex and dentate nuclei (273). The PDCP expression was elevated and increased over time in PD (274) and was higher in those was dementia (277). The level of PDCP expression correlated with memory and executive performance in PD (273) and, unlike PDRP, appeared relatively unaffected by treatments with intravenous levodopa or deep brain stimulation (278), which supports its utility as a reproducible imaging biomarker of cognitive dysfunction in PD.
Specific disease-related metabolic patterns based on 18F-FDG-PET data have also been reported for MSA, PSP (279), and CBS (267) disorders. The MSA-related pattern was elucidated as a metabolic reduction in the putamen and cerebellum, whereas PSP-related pattern showed decreased metabolism in the brainstem and medial frontal cortex compared to normal subjects (273, 279). The CBS-related pattern was characterized by asymmetric, bilateral hypometabolism involving the frontal and parietal cortex, thalamus, and caudate nucleus, where greater abnormalities were found contralateral to the clinically more affected side (267). Although, metabolic asymmetry scores for the CBS-related pattern may help in the differentiation, significant overlap with PSP patients on a case-by-case basis is often observed (267). Furthermore, the CBS-related pattern highly correlates with the features of the clinical syndrome (i.e., where) but does not provide information on the underlying causative pathology (i.e., what). In conjunction with other imaging modalities, these disease-related covariance patterns can be useful for the assessment of metabolic changes due to the underlying pathology as well as in response to disease-modifying therapies (Table 4).
Table 4. Summary of neuroimaging findings in α-synucleinopathies.
Pet Imaging of Neuropathology in Parkinsonian Disorders
Amyloid
Cerebral amyloid deposition can be assessed on PET using 11C-PIB (Pittsburgh compound B) as well as using other 18F-labeled radiotracers (Table 2). Uptake on 11C-PIB PET accurately reflects amyloid deposition antemortem as validated against postmortem neuropathologic findings (280). The apparent gradient of increasing amyloidopathy as visualized on PET can be conceptualized as PD < PD-MCI < PDD < DLB, which has been supported by pathology-proven investigations (281, 282). However, inconsistencies in results may be observed in part due to the substantial pathological heterogeneity evident in these disorders.
An elevated 11C-PIB binding is typically observed in more than 50% of DLB cases, which can be of diagnostic relevance. Compared to controls, studies in DLB have reported elevated amyloid deposition in cortical association areas, frontal and temporoparietal cortices, cingulum and striatum, whereas non-significant differences in 11C-PIB binding were observed in the majority of PDD and all PD cases (283). Amyloid positivity on PET may be more frequent in PDD vs. PD cases, however, such differences were reported inconsistently (284). Compared to DLB, although most studies have found infrequent and modest uptakes in PDD cases (283), others have reported non-significant differences in binding between these two disorders (285). Similarly, a greater 11C-PIB retention was noted in DLB compared to PD, PD-MCI, PDD and controls—where the latter four groups showed no significant differences in the tracer retention (286). Furthermore, the APOE-ε4 allele has been associated with greater 11C-PIB binding in DLB, PDD and PD-MCI cases (286).
Elevated amyloid pathology on PET is most consistently associated with worse global cognition in LBSD, while its relationship with the timing of dementia onset, motor functions, and dementia progression is mixed (285–287). A recent 1 year study in DLB cases reported greater decline in the mini-mental state examination scores and daily functioning in those with amyloid-positive PET scan (288). In PD, the presence of striatal combined with cortical amyloidopathy was associated with greater cognitive dysfunction vs. cortical amyloidopathy alone, which underscores the cumulative and detrimental influence of amyloid deposition on cognition (289).
Greater 11C-PIB binding has also been associated with lower cerebrospinal fluid levels of amyloid beta-42 peptide in LBSD (290, 291). Lower medial temporal lobe perfusion was identified in amyloid-positive DLB cases (292). Glucose hypometabolism was found to align with regions of amyloid presence (293). On the other hand, 11C-PIB retention was virtually absent in MSA patients (293). Amyloid deposition in the brain quantified using 11C-PIB PET may be seen in PSP, MSA, and CBD/CBS disorders, although it may be attributable to age-related changes (294). Importantly, however, significant tracer retention on amyloid PET combined with cerebrospinal fluid findings (reduced amyloid beta-42 and elevated total tau/phospho-tau) may point toward primary Alzheimer's disease (AD) pathology, which is exclusionary to CBD/CBS and PSP diagnoses (3, 15). Thus, amyloid imaging plays a critical role in this regard and any future trials of putative tau-based disease modifying therapies that enroll patients with CBS and PSP would need to exclude AD using these methods.
Tau
Several PET radiotracers have been developed to image tauopathy in the brain (Table 2) (295). These first-generation radiotracers initially developed for AD have generated considerable interest for their potential to quantify the topological distribution of tau, which can be valuable in monitoring disease progression and improving clinical diagnosis of PSP and CBS. However, several challenges have emerged: 1) lack of specificity and variable affinities to the multiple conformations of tau fibrils (e.g., 4R straight chain filaments in PSP vs. 3/4R paired helical filaments in AD), 2) non-negligible off-target binding to neuromelanin and monoamine oxidase A/B, and 3) the role of primary age-related tauopathy, which is not considered pathogenic and may require careful interpretation of PET data. The first-generation tau PET tracers are under study to evaluate their usefulness, and second-generation tracers with improved binding selectivity and pharmacokinetics are being developed (296).
Overall, tau PET studies reveal distinct patterns of tracer retention in tauopathies. Compared to controls, elevated 18F-AV-1451 uptake in PSP cases was observed in the putamen, pallidum, thalamus, midbrain, and cerebellar dentate nucleus (297–300). Likewise, increased 18F-AV-1451 retention in PSP was detected in the basal ganglia, although with extensive overlap and age-dependent increase in both the PSP and control groups (301). Another study included 11C-PIB-negative PSP patients and observed elevated 11C-PBB3 retention in regions similar to those seen using 18F-AV-1451 tracer (302). The midbrain atrophy rate, however, was identified to be a superior progression biomarker for PSP than the change in 18F-AV-1451 tracer retention (299). In PSP vs. PD, increased uptake in the globus pallidus, midbrain, and subthalamus was detected (303, 304). Most studies did not observe a correlation between clinical severity and 18F-AV-1451 uptake in PSP (299, 304), although results are mixed (300). Midbrain 18F-THK5351 uptake was found to correlate with clinical severity in PSP cases (305).
In CBS vs. controls, asymmetrically elevated 18F-AV-1451 binding contralateral to the clinically affected side was evident in the putamen, globus pallidus, and thalamus, as well as in the motor-related GM and WM subcortical structures, including the midbrain (306). Similarly, 18F-AV-1451 retention was observed in the motor cortex, corticospinal tract, and basal ganglia contralateral to the clinically more affected side in CBS, allowing differentiation from AD and PSP (307). However, cortical atrophy on MRI and 18F-FDG-PET reductions were found to be more widespread compared to the 18F-AV-1451 retention, making this technique a less sensitive indicator of neuronal loss (307). This observation may in part be due to the lack of 18F-AV-1451's specificity for 4-repeat tauopathies. Indeed, post-mortem studies have shown significant binding of 18F-AV-1451 to the AD-related paired helical tau filaments. Conversely, 18F-AV-1451 does not bind appreciably to straight tau filaments associated with 4-repeat tauopathies including PSP and CBS (297, 308). Finally, elevated 18F-AV-1451 binding in DLB was reported in the primary sensorimotor and visual cortices with less involvement of the temporal cortex (vs. AD), suggesting a pattern distinct from AD (309).
The 18F-AV-1451 tracer exhibits an off-target binding to neuromelanin neurons in the midbrain (308, 310). Compared to controls, a visually apparent decline in the midbrain 18F-AV-1451 signal has been reported in PD and PSP patients (310, 311), however, no correlation with disease duration or motor dysfunction was observed (298, 310). The utility of this off-target binding in differentiating PD from PSP requires further research (311). The 18F-AV-1451 tracer also shows an off-target binding to monoamine oxidase (MAO) A and B (312). Furthermore, recent investigations have demonstrated the binding of 18F-THK5351 to MAO-B—a marker for astrogliosis (313). Thus, 18F-THK5351 signal may suggest reactive astrocytes expressing MAO-B protein (314) and the utility of this tracer in monitoring the progression of astrogliosis in CBS has been proposed (315). Overall, an off-target binding to MAO (and other targets) can confound PET data, especially given the abundance of these proteins across the entire brain, which can fluctuate during the course of the disease and with treatment interventions.
Recently, it is suggested that 11C-PBB3 and 18F-AV-1451 radioligands may show differential selectivity for the different tau isoforms, with 18F-AV-1451 binding predominantly to AD-type tau deposits, whereas 11C-PBB3 and the THK family of tracers exhibiting a higher affinity for non-AD tau aggregates (i.e., 4R as seen in CBD/PSP) (316, 317). Moreover, besides binding tau aggregates in PSP, the 11C-PBB3 tracer also showed binding in patients expected to have α-synuclein pathology (318). It was suggested that 11C-PBB3 may exhibit off-target binding to α-synuclein or other associated proteins (318), although further studies are required for confirmation. Indeed, given the conformational diversity of tau fibrils, validating ligands specific to different tau strains would be promising in the differential diagnosis of tauopathies, which can be challenging to diagnose at early stages.
Alpha-Synuclein
Successful imaging of α-synuclein pathology using PET radiotracers is expected to be transformative in clinical and research settings. Several radiolabeled probes for imaging α-synucleinopathy in the brain have been explored, including the phenothiazine, indolinone, indolinone-diene and chalcone analogs, and structural congeners (319). However, no radiotracer has currently been approved for use in humans for diagnostic or research purposes. A consortium of researchers has been convened by the Michael J. Fox Foundation to develop α-synuclein PET radiotracers. When developed, these tracers may allow, (1) the identification of patients at prodromal or early stages of an α-synucleinopathy, (2) evaluation of the degree, location, and progression of the disease, as well as therapeutic effectiveness, (3) differentiation of α-synucleinopathies (LBSD and MSA) from tauopathies (PSP and CBD) and AD, and (4) insights into the contribution of α-synuclein pathology for clinical outcomes (320). Some of the developmental challenges [see reference (321)], although similar to those of tau PET radiotracers, include the intracellular nature of most α-synuclein aggregates requiring ideal lipophilicity and molecular size, multiple α-synuclein strains that may interact differently with some tracers, colocalization of α-synuclein with other protein aggregates, relatively less abundance of α-synuclein over amyloid and tau aggregates requiring higher tracer selectivity, as well as the potential for off-target binding which may necessitate further validation.
Pet Imaging of Neuroinflammation in Parkinsonian Disorders
Microglia are the primary macrophages involved in the innate immune response of the central nervous system. It is suggested that microglia-mediated inflammatory processes can aggravate injury, leading to events that may result in neurodegeneration (322). A widely used PET ligand for imaging neuroinflammation has been 11C-PK11195, which binds to the 18 kDa translocator protein (TSPO), located on the outer mitochondrial membrane in microglia. Upregulation of TSPO is suggestive of microglial activation in the central nervous system. However, there are several limitations of 11C-PK11195 (e.g., non-specific binding, low brain penetration, high plasma protein binding), which has prompted the development of improved second-generation radiotracers, including 11C-PBR28 and 18F-FEPPA (323).
Compared to controls, increased 11C-PK11195 binding in PD was observed in the pons, basal ganglia, frontal and temporal cortices (324), as well as in the midbrain contralateral to the clinically affected side (325). The correlation of 11C-PK11195 binding with clinical severity or with putaminal presynaptic dopaminergic integrity is inconsistently reported (324, 325). Recently, considerable interindividual variability in the binding affinity of second-generation radiotracers (e.g., 18F-FEPPA) to the TSPO protein has been observed, which is attributed to a single nucleotide polymorphism located at exon 4 of the TSPO gene (rs6971) (323, 326). Three patterns of binding affinities based on this genetic polymorphism have been identified: low, high, and mixed affinity binders. This finding suggests a possible interaction between the rs6791 polymorphism and neuroinflammation resulting in interindividual variability in the outcome measures. Further studies are warranted to study this interaction. Increased 18F-FEPPA binding was also reported in PD-MCI in the frontal and temporal lobe, striatum, precuneus, and dorsolateral prefrontal cortex in association with amyloid deposition in these regions (327), suggesting a link between amyloidopathy and neuroinflammation.
RBD is a significant risk factor for the development of α-synucleinopathies (236). In polysomnography-confirmed cases with idiopathic RBD, elevated 11C-PK11195 binding was reported in the occipital lobe (probably highlighting those at increased risk of developing DLB) (328), as well as in the left SN, although no significant differences in 11C-PK11195 binding were noted in the putamen or caudate (despite lower putaminal 18F-dopa uptake) (329). Longitudinal studies are needed to identify biomarkers for those likely to convert earlier vs. later into an overt symptomatic synucleinopathy (i.e., dementia or parkinsonism) when presenting with RBD.
PDD patients exhibited widespread microglial activation vs. controls in the anterior and posterior cingulate, striatum, as well as in the frontal, temporal, parietal, and occipital cortices, with pronounced parieto-occipital binding (330). Compared to PD, however, the spatial extent of microglial cortical involvement was greater in PDD (330). Additionally, an inverse correlation between microglial activation and glucose metabolism in the temporoparietal cortex has been reported in PDD (331). As consistent with the known neuropathological burden, augmented 11C-PK11195 binding compared to controls was evident in the dorsolateral prefrontal cortex, putamen, pallidum, pons, and SN in MSA cases (332), and in the basal ganglia, midbrain, frontal lobe, and cerebellum in PSP cases (324). Microglial activity in PSP-RS was identified in the thalamus, putamen, and pallidum (333). Finally, CBS patients typically show 11C-PK11195 uptake in the caudate nucleus, putamen, SN, pons, pre- and post-central gyrus and the frontal lobe (334). Although, the overall patterns of microglial activity align with neuropathological findings, these patterns may not allow differentiation in a clinical setting, and may be more appropriate as biomarkers of prodromal changes or therapeutic effectiveness in clinical trials.
Summary of neuroimaging findings in α-synucleinopathies and tauopathies are presented (Tables 4, 5).
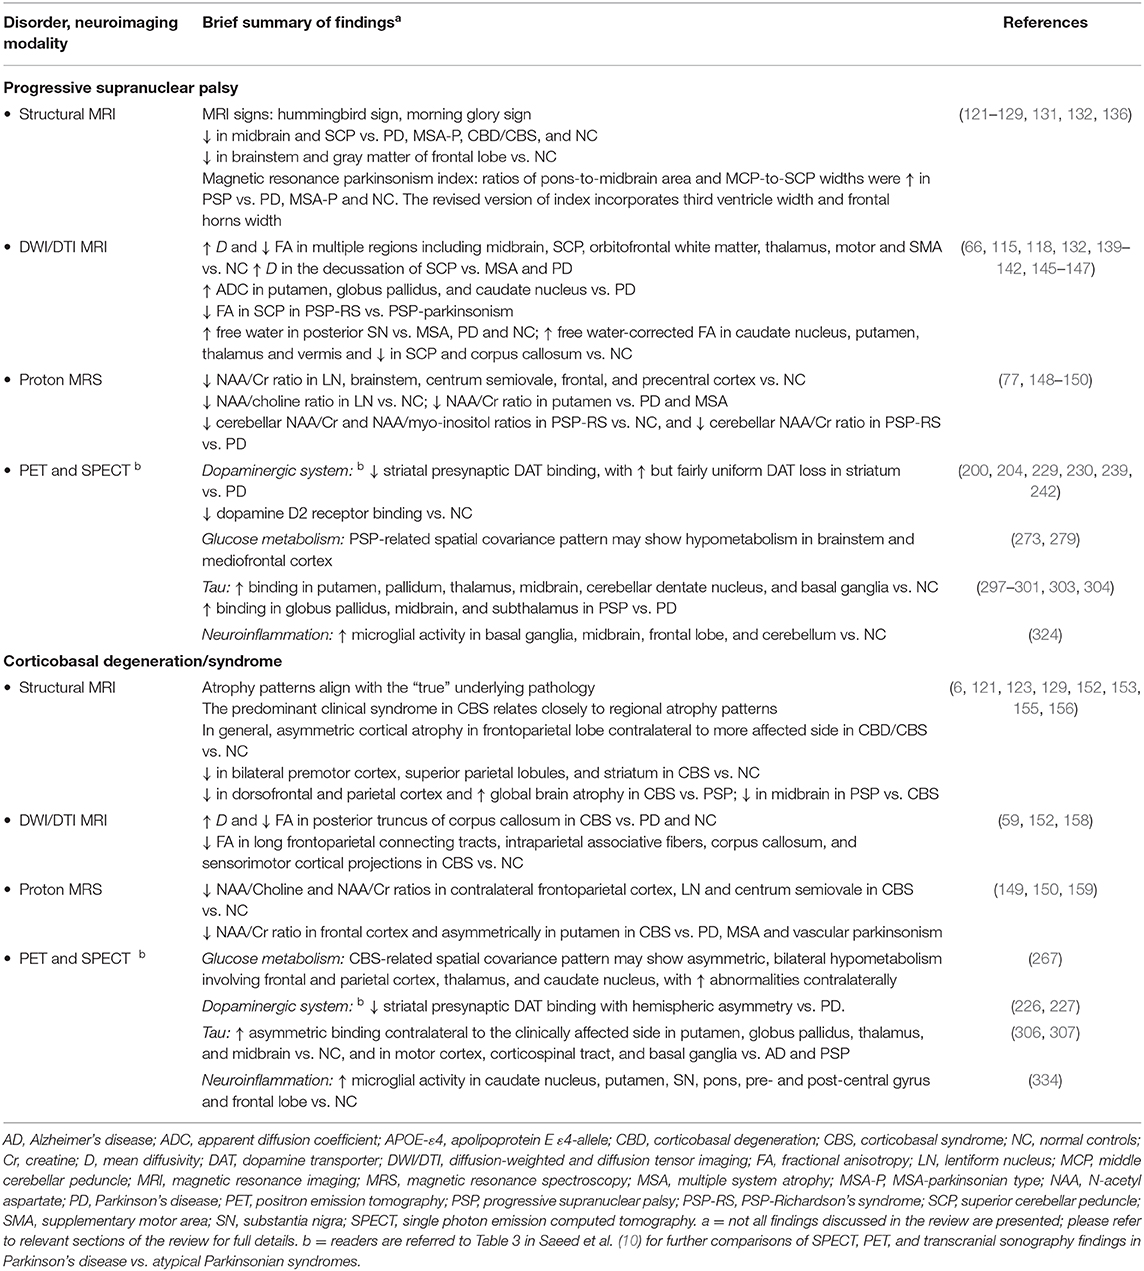
Table 5. Summary of neuroimaging findings in tauopathies.
Conclusions
Research using multimodal neuroimaging has facilitated a better understanding of the disease processes in PD and atypical PS—neurodegenerative disorders that often present with substantial clinical and pathological heterogeneity. As per the “multimodal approach,” multiple biomarkers obtained from different neuroimaging modalities can provide distinct yet corroborative data on the underlying neurodegenerative processes, and this integrative approach may prove superior to single-modality-based methods. Future efforts are needed to validate biomarkers in well-characterized cohorts. Some of these biomarkers may help improve the current consensus diagnostic guidelines and allow clinicians to ascertain an optimal approach for diagnostic purposes in combination with their experience and professional training.
Author Contributions
US reviewed the literature, wrote the manuscript, and prepared tables and figures. MM supervised the writing of this review paper. MM and AL reviewed and critiqued the manuscript for intellectual content. All authors read and approved the final manuscript.
Conflict of Interest
The authors declare that the research was conducted in the absence of any commercial or financial relationships that could be construed as a potential conflict of interest.
Acknowledgments
The authors would like to acknowledge support from New Investigator Award from Parkinson Society Canada and Early Researcher Award to MM from the Ministry of Research, Innovation, and Science (MRIS; Ontario). The authors also acknowledge support from the Ontario Brain Institute, an independent non-profit corporation, funded partially by the Ontario government. The opinions, results and conclusions are those of the authors and no endorsement by the Ontario Brain Institute is intended or should be inferred. Matching funds were provided by participating hospital and research institute foundations, including the Baycrest Foundation, Bruyère Research Institute, Center for Addiction and Mental Health Foundation, London Health Sciences Foundation, McMaster University Faculty of Health Sciences, Ottawa Brain and Mind Research Institute, Queen's University Faculty of Health Sciences, Providence Care (Kingston), St. Michael's Hospital, Sunnybrook Health Sciences Foundation, the Thunder Bay Regional Health Sciences Center, the University of Ottawa Faculty of Medicine, and the Windsor/Essex County ALS Association.
Abbreviations
AADC, Aromatic amino acid decarboxylase; AD, Alzheimer's disease; ADC, Apparent diffusion coefficient; APOE-ε4, Apolipoprotein E ε4-allele; CBD, Corticobasal degeneration; CBS, Corticobasal syndrome; Cr, Creatine; D, Mean diffusivity; DAT, Dopamine transporter; DLB, Dementia with Lewy bodies; DTI, Diffusion tensor imaging; FA, Fractional anisotropy; GM, Gray matter; LBSD, Lewy body spectrum disorders; LN, Lentiform nucleus; MAO, Monoamine oxidase; MCP, Middle cerebellar peduncle; MRI, Magnetic resonance imaging; MSA, Multiple system atrophy; MSA-C, Multiple system atrophy-cerebellar type; MSA-P, Multiple system atrophy-parkinsonian type; NAA, N-acetyl aspartate; NPV, Negative predictive value; PD, Parkinson's disease; PDD, Parkinson's disease dementia; PD-MCI, Parkinson's disease-mild cognitive impairment; PDRP, Parkinson's disease-related motor pattern; PDCP, Parkinson's disease-related cognitive pattern; PET, Positron emission tomography; PPV, Positive predictive value; PS, Parkinsonian syndrome; PSP, Progressive supranuclear palsy; PSP-RS, Progressive supranuclear palsy-Richardson's syndrome; RBD, Rapid eye movement sleep behavior disorder; SCP, Superior cerebellar peduncle; SN, Substantia nigra; SNpc, Substantia nigra pars compacta; SPECT, Single photon emission computed tomography; TDP-43, Transactive response DNA binding protein-43 kDa; TSPO, Translocator protein-18 kDa; VBM, Voxel-based morphometry; VMAT2, Vesicular monoamine transporter type 2; WM, White matter.
References
1. Parkinson's Disease Foundation. Statistics. Available online at: https://www.parkinson.org/Understanding-Parkinsons/Statistics (accessed April 14, 2020).
2. Kalia LV, Lang AE. Parkinson's disease. Lancet. (2015) 386:896–912. doi: 10.1016/S0140-6736(14)61393-3
3. Höglinger GU, Respondek G, Stamelou M, Kurz C, Josephs KA, Lang AE, et al. Clinical diagnosis of progressive supranuclear palsy: the movement disorder society criteria. Mov Disord. (2017) 32:853–64. doi: 10.1002/mds.26987
4. Armstrong MJ. Progressive supranuclear palsy: an update. Curr Neurol Neurosci Rep. (2018) 18:12. doi: 10.1007/s11910-018-0819-5
5. Wadia PM, Lang AE. The many faces of corticobasal degeneration. Parkinsonism Relat Disord. (2007) 13(Suppl. 3):S336–40. doi: 10.1016/S1353-8020(08)70027-0
6. Lee SE, Rabinovici GD, Mayo MC, Wilson SM, Seeley WW, Dearmond SJ, et al. Clinicopathological correlations in corticobasal degeneration. Ann Neurol. (2011) 70:327–40. doi: 10.1002/ana.22424
7. Braak H, Del Tredici K, Rüb U, De Vos RAI, Jansen Steur ENH, Braak E. Staging of brain pathology related to sporadic Parkinson's disease. Neurobiol Aging. (2003) 24:197–211. doi: 10.1016/S0197-4580(02)00065-9
8. McKeith IG, Boeve BF, Dickson DW, Halliday G, Taylor J-P, Weintraub D, et al. Diagnosis and management of dementia with lewy bodies: fourth consensus report of the DLB consortium. Neurology. (2017) 89:88–100. doi: 10.1212/WNL.0000000000004058
9. Saeed U, Mirza SS, MacIntosh BJ, Herrmann N, Keith J, Ramirez J, et al. APOE-ε4 associates with hippocampal volume, learning, and memory across the spectrum of alzheimer's disease and dementia with lewy bodies. Alzheimer's Dement. (2018) 14:1137–47. doi: 10.1016/j.jalz.2018.04.005
10. Saeed U, Compagnone J, Aviv RI, Strafella AP, Black SE, Lang AE, et al. Imaging biomarkers in Parkinson's disease and parkinsonian syndromes: current and emerging concepts. Transl Neurodegen. (2017) 6:8. doi: 10.1186/s40035-017-0076-6
11. Fanciulli A, Wenning GK. Multiple-system atrophy. N Engl J Med. (2015) 372:249–63. doi: 10.1056/NEJMra1311488
12. Erkkinen MG, Kim MO, Geschwind MD. Clinical neurology and epidemiology of the major neurodegenerative diseases. Cold Spring Harb Perspect Biol. (2018) 10:a033118. doi: 10.1101/cshperspect.a033118
13. Dickson DW, Rademakers R, Hutton ML. Progressive supranuclear palsy: pathology and genetics. Brain Pathol. (2007) 17:74–82. doi: 10.1111/j.1750-3639.2007.00054.x
14. Williams DR, Lees AJ. Progressive supranuclear palsy: clinicopathological concepts and diagnostic challenges. Lancet Neurol. (2009) 8:270–79. doi: 10.1016/S1474-4422(09)70042-0
15. Armstrong MJ, Litvan I, Lang AE, Bak TH, Bhatia KP, Borroni B, et al. Criteria for the diagnosis of corticobasal degeneration. Neurology. (2013) 80:496–503. doi: 10.1212/WNL.0b013e31827f0fd1
16. Rana AQ, Saeed U, Masroor MS, Yousuf MS, Siddiqui I. A cross-sectional study investigating clinical predictors and physical experiences of pain in Parkinson's disease. Funct Neurol. (2013) 28:297–304.
17. Postuma RB, Berg D, Stern M, Poewe W, Olanow CW, Oertel W, et al. MDS clinical diagnostic criteria for Parkinson's disease. Mov Disord. (2015) 30:1591–601. doi: 10.1002/mds.26424
18. Jellinger KA, Korczyn AD. Are dementia with lewy bodies and Parkinson's disease dementia the same disease? BMC Med. (2018) 16:34. doi: 10.1186/s12916-018-1016-8
19. Gilman S, Wenning GK, Low PA, Brooks DJ, Mathias CJ, Trojanowski JQ, et al. Second consensus statement on the diagnosis of multiple system atrophy. Neurology. (2008) 71:670–6. doi: 10.1212/01.wnl.0000324625.00404.15
20. Respondek G, Stamelou M, Kurz C, Ferguson LW, Rajput A, Chiu WZ, et al. The phenotypic spectrum of progressive supranuclear palsy: a retrospective multicenter study of 100 definite cases. Mov Disord. (2014) 29:1758–66. doi: 10.1002/mds.26054
21. Litvan I, Agid Y, Goetz C, Jankovic J, Wenning GK, Brandel JP, et al. Accuracy of the clinical diagnosis of corticobasal degeneration: a clinicopathologic study. Neurology. (1997) 48:119–25. doi: 10.1212/WNL.48.1.119
22. Xu X, Han Q, lin J, Wang L, Wu F, Shang H. Grey matter abnormalities in Parkinson's disease: a voxel-wise meta-analysis. Eur J Neurol. (2019) 27:653–9. doi: 10.1111/ene.14132
23. Burton EJ, McKeith IG, Burn DJ, Williams ED, O'Brien JT. Cerebral atrophy in Parkinson's disease with and without dementia: a comparison with Alzheimer's disease, dementia with Lewy bodies and controls. Brain. (2004) 127:791–800. doi: 10.1093/brain/awh088
24. Summerfield C, Junqué C, Tolosa E, Salgado-Pineda P, Gómez-Ansón B, Martí MJ, et al. Structural brain changes in Parkinson disease with dementia: a voxel-based morphometry study. Arch Neurol. (2005) 62:281–5. doi: 10.1001/archneur.62.2.281
25. Tinaz S, Courtney MG, Stern CE. Focal cortical and subcortical atrophy in early Parkinson's disease. Mov Disord. (2011) 26:436–41. doi: 10.1002/mds.23453
26. Pitcher TL, Melzer TR, MacAskill MR, Graham CF, Livingston L, Keenan RJ, et al. Reduced striatal volumes in Parkinson's disease: a magnetic resonance imaging study. Transl Neurodegener. (2012) 1:17 doi: 10.1186/2047-9158-1-17
27. Tessitore A, Amboni M, Cirillo G, Corbo D, Picillo M, Russo A, et al. Regional gray matter atrophy in patients with Parkinson disease and freezing of gait. AJNR Am J Neuroradiol. (2012) 33:1804–9. doi: 10.3174/ajnr.A3066
28. Schulz JB, Skalej M, Wedekind D, Luft AR, Abele M, Voigt K, et al. Magnetic resonance imaging-based volumetry differentiates idiopathic Parkinson's syndrome from multiple system atrophy and progressive supranuclear palsy. Ann Neurol. (1999) 45:65–74.
29. Chen S, Tan H-Y, Wu Z-H, Sun C-P, He J-X, Li X-C, et al. Imaging of olfactory bulb and gray matter volumes in brain areas associated with olfactory function in patients with Parkinson's disease and multiple system atrophy. Eur J Radiol. (2013) 83:564–70. doi: 10.1016/j.ejrad.2013.11.024
30. Lee SY, Chen MH, Chiang PL, Chen HL, Chou KH, Chen YC, et al. Reduced gray matter volume and respiratory dysfunction in Parkinson's disease: a voxel-based morphometry study. BMC Neurol. (2018) 18:73. doi: 10.1186/s12883-018-1074-8
31. Blair JC, Barrett MJ, Patrie J, Flanigan JL, Sperling SA, Elias WJ, et al. Brain MRI reveals ascending atrophy in Parkinson's disease across severity. Front Neurol. (2019) 10:1329. doi: 10.3389/fneur.2019.01329
32. Visanji NP, Brooks PL, Hazrati L-N, Lang AE. The prion hypothesis in Parkinson's disease: braak to the future. Acta Neuropathol Commun. (2013) 1:2. doi: 10.1186/2051-5960-1-2
33. Fonov V, Evans AC, Botteron K, Almli CR, McKinstry RC, Collins DL. Unbiased average age-appropriate atlases for pediatric studies. Neuroimage. (2011) 54:313–27. doi: 10.1016/j.neuroimage.2010.07.033
34. Damier P, Hirsch EC, Agid Y, Graybiel AM. The substantia nigra of the human brain: I. Nigrosomes and the nigral matrix, a compartmental organization based on calbindin D(28K) immunohistochemistry. Brain. (1999) 122:1421–36. doi: 10.1093/brain/122.8.1421
35. Damier P, Hirsch EC, Agid Y, Graybiel AM. The substantia nigra of the human brain: II. Patterns of loss of dopamine-containing neurons in Parkinson's disease. Brain. (1999) 122:1437–48. doi: 10.1093/brain/122.8.1437
36. Blazejewska AI, Schwarz ST, Pitiot A, Stephenson MC, Lowe J, Bajaj N, et al. Visualization of nigrosome 1 and its loss in PD: pathoanatomical correlation and in vivo 7 T MRI. Neurology. (2013) 81:534–40. doi: 10.1212/WNL.0b013e31829e6fd2
37. Castellanos G, Fernández-Seara MA, Lorenzo-Betancor O, Ortega-Cubero S, Puigvert M, Uranga J, et al. Automated neuromelanin imaging as a diagnostic biomarker for Parkinson's disease. Mov Disord. (2015) 30:945–52. doi: 10.1002/mds.26201
38. Lehéricy S, Bardinet E, Poupon C, Vidailhet M, François C. 7 Tesla magnetic resonance imaging: a closer look at substantia nigra anatomy in Parkinson's disease. Mov Disord. (2014) 29:1574–81. doi: 10.1002/mds.26043
39. Schwarz ST, Afzal M, Morgan PS, Bajaj N, Gowland PA, Auer DP. The “swallow tail” appearance of the healthy nigrosome - a new accurate test of Parkinson's disease: a case-control and retrospective cross-sectional MRI study at 3T. PLoS ONE. (2014) 9:e93814. doi: 10.1371/journal.pone.0093814
40. Chougar L, Pyatigorskaya N, Degos B, Grabli D, Lehéricy S. The role of magnetic resonance imaging for the diagnosis of atypical parkinsonism. Front Neurol. (2020) 11:665. doi: 10.3389/fneur.2020.00665
41. Reimão S, Pita Lobo P, Neutel D, Guedes LC, Coelho M, Rosa MM, et al. Substantia nigra neuromelanin-MR imaging differentiates essential tremor from Parkinson's disease. Mov Disord. (2015) 30:953–9. doi: 10.1002/mds.26182
42. Rahayel S, Gaubert M, Postuma RB, Montplaisir J, Carrier J, Monchi O, et al. Brain atrophy in Parkinson's disease with polysomnographyconfirmed REM sleep behavior disorder. Sleep. (2019) 42:zsz062. doi: 10.1093/sleep/zsz062
43. Kamps S, van den Heuvel OA, van der Werf YD, Berendse HW, Weintraub D, Vriend C. Smaller subcortical volume in Parkinson patients with rapid eye movement sleep behavior disorder. Brain Imaging Behav. (2019) 13:1352–60. doi: 10.1007/s11682-018-9939-4
44. Barber TR, Griffanti L, Bradley KM, McGowan DR, Lo C, Mackay CE, et al. Nigrosome 1 imaging in REM sleep behavior disorder and its association with dopaminergic decline. Ann Clin Transl Neurol. (2020) 7:26–35. doi: 10.1002/acn3.50962
45. Oikawa H, Sasaki M, Tamakawa Y, Ehara S, Tohyama K. The substantia nigra in Parkinson disease: proton density-weighted spin-echo and fast short inversion time inversion-recovery MR findings. Am J Neuroradiol. (2002) 23:1747–56.
46. Péran P, Cherubini A, Assogna F, Piras F, Quattrocchi C, Peppe A, et al. Magnetic resonance imaging markers of Parkinson's disease nigrostriatal signature. Brain. (2010) 133:3423–33. doi: 10.1093/brain/awq212
47. Minati L, Grisoli M, Carella F, De Simone T, Bruzzone MG, Savoiardo M. Imaging degeneration of the substantia Nigra in Parkinson disease with inversion-recovery MR imaging. Am J Neuroradiol. (2007) 28:309–13.
48. Kwon D-H, Kim J-M, Oh S-H, Jeong H-J, Park S-Y, Oh E-S, et al. Seven-Tesla magnetic resonance images of the substantia nigra in Parkinson disease. Ann Neurol. (2012) 71:267–77. doi: 10.1002/ana.22592
49. Cho Z-H, Oh S-H, Kim J-M, Park S-Y, Kwon D-H, Jeong H-J, et al. Direct visualization of Parkinson's disease by in vivo human brain imaging using 7.0T magnetic resonance imaging. Mov Disord. (2011) 26:713–8. doi: 10.1002/mds.23465
50. Cosottini M, Frosini D, Pesaresi I, Costagli M, Biagi L, Ceravolo R, et al. MR imaging of the substantia nigra at 7 T enables diagnosis of Parkinson disease. Radiology. (2014) 271:831–8. doi: 10.1148/radiol.14131448
51. Ulla M, Bonny JM, Ouchchane L, Rieu I, Claise B, Durif F. Is a new MRI biomarker for the progression of Parkinson's disease? A longitudinal follow-up. PLoS ONE. (2013) 8:e57904. doi: 10.1371/journal.pone.0057904
52. Arribarat G, Pasternak O, De Barros A, Galitzky M, Rascol O, Péran P. Substantia nigra locations of iron-content, free-water and mean diffusivity abnormalities in moderate stage Parkinson's disease. Parkinsonism Relat Disord. (2019) 65:146–52. doi: 10.1016/j.parkreldis.2019.05.033
53. Wieler M, Gee M, Camicioli R, Martin WRW. Freezing of gait in early Parkinson's disease: nigral iron content estimated from magnetic resonance imaging. J Neurol Sci. (2016) 361:87–91. doi: 10.1016/j.jns.2015.12.008
54. Acosta-Cabronero J, Cardenas-Blanco A, Betts MJ, Butryn M, Valdes-Herrera JP, Galazky I, et al. The whole-brain pattern of magnetic susceptibility perturbations in Parkinson's disease. Brain. (2017) 140:118–31. doi: 10.1093/brain/aww278
55. Cochrane CJ, Ebmeier KP. Diffusion tensor imaging in parkinsonian syndromes: a systematic review and meta-analysis. Neurology. (2013) 80:857–64. doi: 10.1212/WNL.0b013e318284070c
56. Vaillancourt DE, Prodoehl J, Abraham I, Corcos DM, Zhou XJ, Cornelia CL, et al. High-resolution diffusion tensor imaging in the substantia nigra of de novo Parkinson disease. Neurology. (2009) 72:1378–84. doi: 10.1212/01.wnl.0000340982.01727.6e
57. Scherfler C, Schocke MF, Seppi K, Esterhammer R, Brenneis C, Jaschke W, et al. Voxel-wise analysis of diffusion weighted imaging reveals disruption of the olfactory tract in Parkinson's disease. Brain. (2006) 129:538–42. doi: 10.1093/brain/awh674
58. Rolheiser TM, Fulton HG, Good KP, Fisk JD, McKelvey JR, Scherfler C, et al. Diffusion tensor imaging and olfactory identification testing in early-stage Parkinson's disease. J Neurol. (2011) 258:1254–60. doi: 10.1007/s00415-011-5915-2
59. Boelmans K, Bodammer NC, Suchorska B, Kaufmann J, Ebersbach G, Heinze HJ, et al. Diffusion tensor imaging of the corpus callosum differentiates corticobasal syndrome from Parkinson's disease. Parkinsonism Relat Disord. (2010) 16:498–502. doi: 10.1016/j.parkreldis.2010.05.006
60. Schulz J, Pagano G, Fernández Bonfante JA, Wilson H, Politis M. Nucleus basalis of meynert degeneration precedes and predicts cognitive impairment in Parkinson's disease. Brain. (2018) 141:1501–16. doi: 10.1093/brain/awy072
61. Du G, Lewis MM, Kanekar S, Sterling NW, He L, Kong L, et al. Combined diffusion tensor imaging and apparent transverse relaxation rate differentiate Parkinson disease and atypical parkinsonism. Am J Neuroradiol. (2017) 38:966–72. doi: 10.3174/ajnr.A5136
62. Safai A, Prasad S, Chougule T, Saini J, Pal PK, Ingalhalikar M. Microstructural abnormalities of substantia nigra in Parkinson's disease: a neuromelanin sensitive MRI atlas based study. Hum Brain Map. (2019) 41:1323–33. doi: 10.1101/686154
63. Bledsoe IO, Stebbins GT, Merkitch D, Goldman JG. White matter abnormalities in the corpus callosum with cognitive impairment in Parkinson disease. Neurology. (2018) 91:e2244–55. doi: 10.1212/WNL.0000000000006646
64. Burciu RG, Ofori E, Archer DB, Wu SS, Pasternak O, McFarland NR, et al. Progression marker of Parkinson's disease: a 4-year multi-site imaging study. Brain. (2017) 140:2183–92. doi: 10.1093/brain/awx146
65. Ofori E, Pasternak O, Planetta PJ, Li H, Burciu RG, Snyder AF, et al. Longitudinal changes in free-water within the substantia nigra of Parkinson's disease. Brain. (2015) 138:2322–31. doi: 10.1093/brain/awv136
66. Planetta PJ, Ofori E, Pasternak O, Burciu RG, Shukla P, Desimone JC, et al. Free-water imaging in Parkinson's disease and atypical parkinsonism. Brain. (2016) 139:495–508. doi: 10.1093/brain/awv361
67. Guttuso T, Bergsland N, Hagemeier J, Lichter DG, Pasternak O, Zivadinov R. Substantia nigra free water increases longitudinally in Parkinson disease. Am J Neuroradiol. (2018) 39:479–84. doi: 10.3174/ajnr.A5545
68. Ofori E, Pasternak O, Planetta PJ, Burciu R, Snyder A, Febo M, et al. Increased free water in the substantia nigra of Parkinson's disease: a single-site and multi-site study. Neurobiol Aging. (2015) 36:1097–104. doi: 10.1016/j.neurobiolaging.2014.10.029
69. Guan J, Rong Y, Wen Y, Wu H, Qin H, Zhang Q, et al. Detection and application of neurochemical profile by multiple regional 1H-MRS in Parkinson's disease. Brain Behav. (2017) 7:e00792. doi: 10.1002/brb3.792
70. Cao H, Shi J, Cao B, Kang B, Zhang M, Qu Q. Evaluation of the braak staging of brain pathology with 1H-MRS in patients with Parkinson's disease. Neurosci Lett. (2017) 660:57–62. doi: 10.1016/j.neulet.2017.08.050
71. Tsuda M, Asano S, Kato Y, Murai K, Miyazaki M. Differential diagnosis of multiple system atrophy with predominant parkinsonism and Parkinson's disease using neural networks. J Neurol Sci. (2019) 401:19–26. doi: 10.1016/j.jns.2019.04.014
72. Taylor-Robinson SD, Turjanski N, Bhattacharya S, Seery JP, Sargentoni J, Brooks DJ, et al. A proton magnetic resonance spectroscopy study of the striatum and cerebral cortex in Parkinson's disease. Metab Brain Dis. (1999) 14:45–55. doi: 10.1023/A:1020609530444
73. Camicioli RM, Hanstock CC, Bouchard TP, Gee M, Fisher NJ, Martin WRW. Magnetic resonance spectroscopic evidence for presupplementary motor area neuronal dysfunction in Parkinson's disease. Mov Disord. (2007) 22:382–6. doi: 10.1002/mds.21288
74. Firbank MJ, Harrison RM, O'Brien JT. A comprehensive review of proton magnetic resonance spectroscopy studies in dementia and Parkinson's disease. Dement Geriatr Cogn Disord. (2002) 14:64–76. doi: 10.1159/000064927
75. Gröger A, Bender B, Wurster I, Chadzynski GL, Klose U, Berg D. Differentiation between idiopathic and atypical parkinsonian syndromes using three-dimensional magnetic resonance spectroscopic imaging. J Neurol Neurosurg Psychiatry. (2013) 84:644–9. doi: 10.1136/jnnp-2012-302699
76. Barbagallo G, Arabia G, Morelli M, Nisticò R, Novellino F, Salsone M, et al. Thalamic neurometabolic alterations in tremulous Parkinson's disease: a preliminary proton MR spectroscopy study. Parkinsonism Relat Disord. (2017) 43:78–84. doi: 10.1016/j.parkreldis.2017.07.028
77. Zanigni S, Testa C, Calandra-Buonaura G, Sambati L, Guarino M, Gabellini A, et al. The contribution of cerebellar proton magnetic resonance spectroscopy in the differential diagnosis among parkinsonian syndromes. Parkinsonism Relat Disord. (2015) 21:929–37. doi: 10.1016/j.parkreldis.2015.05.025
78. Mazuel L, Chassain C, Jean B, Pereira B, Cladiere A, Speziale C, et al. Proton MR spectroscopy for diagnosis and evaluation of treatment efficacy in parkinson disease. Radiology. (2015) 278:142764. doi: 10.1148/radiol.2015142764
79. Beyer MK, Larsen JP, Aarsland D. Gray matter atrophy in Parkinson disease with dementia and dementia with lewy bodies. Neurology. (2007) 69:747–54. doi: 10.1212/01.wnl.0000269666.62598.1c
80. Goldman JG, Stebbins GT, Bernard B, Stoub TR, Goetz CG, deToledo-Morrell L. Entorhinal cortex atrophy differentiates Parkinson's disease patients with and without dementia. Mov Disord. (2012) 27:727–34. doi: 10.1002/mds.24938
81. Mak E, Gabel S, Su L, Williams GB, Arnold R, Passamonti L, et al. Multi-modal MRI investigation of volumetric and microstructural changes in the hippocampus and its subfields in mild cognitive impairment, Alzheimer's disease, and dementia with lewy bodies. Int Psychogeriatr. (2017) 29:545–55. doi: 10.1017/S1041610216002143
82. Adamowicz DH, Roy S, Salmon DP, Galasko DR, Hansen LA, Masliah E, et al. Hippocampal α-synuclein in dementia with lewy bodies contributes to memory impairment and is consistent with spread of pathology. J Neurosci. (2017) 37:1675–84. doi: 10.1523/JNEUROSCI.3047-16.2016
83. Camicioli R, Moore MM, Kinney A, Corbridge E, Glassberg K, Kaye JA. Parkinson's disease is associated with hippocampal atrophy. Mov Disord. (2003) 18:784–90. doi: 10.1002/mds.10444
84. Cousins DA, Burton EJ, Burn D, Gholkar a, McKeith IG, O'Brien JT. Atrophy of the putamen in dementia with lewy bodies but not Alzheimer's disease: an MRI study. Neurology. (2003) 61:1191–5. doi: 10.1212/01.WNL.0000091889.20347.30
85. Joki H, Higashiyama Y, Nakae Y, Kugimoto C, Doi H, Kimura K, et al. White matter hyperintensities on MRI in dementia with Lewy bodies, Parkinson's disease with dementia, and Alzheimer's disease. J Neurol Sci. (2018) 385:99–104. doi: 10.1016/j.jns.2017.12.018
86. Hanganu A, Bedetti C, Degroot C, Mejia-Constain B, Lafontaine AL, Soland V, et al. Mild cognitive impairment is linked with faster rate of cortical thinning in patients with Parkinson's disease longitudinally. Brain. (2014) 137:1120–9. doi: 10.1093/brain/awu036
87. Zheng D, Chen C, Song WC, Yi ZQ, Zhao PW, Zhong JG, et al. Regional gray matter reductions associated with mild cognitive impairment in Parkinson's disease: a meta-analysis of voxel-based morphometry studies. Behav Brain Res. (2019) 371:111973. doi: 10.1016/j.bbr.2019.111973
88. Weintraub D, Dietz N, Duda JE, Wolk DA, Doshi J, Xie SX, et al. Alzheimer's disease pattern of brain atrophy predicts cognitive decline in Parkinson's disease. Brain. (2012) 135:170–80. doi: 10.1093/brain/awr277
89. Guerreiro R, Ross OA, Kun-Rodrigues C, Hernandez DG, Orme T, Eicher JD, et al. Investigating the genetic architecture of dementia with lewy bodies: a two-stage genome-wide association study. Lancet Neurol. (2018) 17:64–74. doi: 10.1016/S1474-4422(17)30400-3
90. Mirza SS, Saeed U, Knight J, Ramirez J, Stuss DT, Keith J, et al. APOE ε4, white matter hyperintensities, and cognition in Alzheimer and lewy body dementia. Neurology. (2019) 93:e1807–19. doi: 10.1212/WNL.0000000000008377
91. Dickson DW, Heckman MG, Murray ME, Soto AI, Walton RL, Diehl NN, et al. APOE ε4 is associated with severity of lewy body pathology independent of Alzheimer pathology. Neurology. (2018) 91:e1182–95. doi: 10.1212/WNL.0000000000006212
92. Bozzali M, Falini A, Cercignani M, Baglio F, Farina E, Alberoni M, et al. Brain tissue damage in dementia with lewy bodies: an in vivo diffusion tensor MRI study. Brain. (2005) 128:1595–604. doi: 10.1093/brain/awh493
93. Kantarci K, Avula R, Senjem ML, Samikoglu AR, Zhang B, Weigand SD, et al. Dementia with lewy bodies and Alzheimer disease: neurodegenerative patterns characterized by DTI. Neurology. (2010) 74:1814–21. doi: 10.1212/WNL.0b013e3181e0f7cf
94. Firbank MJ, Blamire AM, Krishnan MS, Teodorczuk A, English P, Gholkar A, et al. Diffusion tensor imaging in dementia with lewy bodies and Alzheimer's disease. Psychiatry Res. (2007) 155:135–45. doi: 10.1016/j.pscychresns.2007.01.001
95. Matsui H, Nishinaka K, Oda M, Niikawa H, Kubori T, Udaka F. Dementia in Parkinson's disease: diffusion tensor imaging. Acta Neurol Scand. (2007) 116:177–81. doi: 10.1111/j.1600-0404.2007.00838.x
96. Watson R, Blamire AM, Colloby SJ, Wood JS, Barber R, He J, et al. Characterizing dementia with lewy bodies by means of diffusion tensor imaging. Neurology. (2012) 79:906–14. doi: 10.1212/WNL.0b013e318266fc51
97. Xuan X, Ding M, Gong X. Proton magnetic resonance spectroscopy detects a relative decrease of N-acetylaspartate in the hippocampus of patients with dementia with lewy bodies. J Neuroimag. (2008) 18:137–41. doi: 10.1111/j.1552-6569.2007.00203.x
98. Griffith HR, den Hollander JA, Okonkwo OC, O'Brien T, Watts RL, Marson DC. Brain N-acetylaspartate is reduced in Parkinson disease with dementia. Alzheimer Dis Assoc Disord. (2008) 22:54–60. doi: 10.1097/WAD.0b013e3181611011
99. Massey L a, Micallef C, Paviour DC, O'Sullivan SS, Ling H, Williams DR, et al. Conventional magnetic resonance imaging in confirmed progressive supranuclear palsy and multiple system atrophy. Mov Disord. (2012) 27:1754–62. doi: 10.1002/mds.24968
100. Deguchi K, Ikeda K, Kume K, Takata T, Kokudo Y, Kamada M, et al. Significance of the hot-cross bun sign on T2*-weighted MRI for the diagnosis of multiple system atrophy. J Neurol. (2015) 262:1433–9. doi: 10.1007/s00415-015-7728-1
101. Wang Y, Butros SR, Shuai X, Dai Y, Chen C, Liu M, et al. Different iron-deposition patterns of multiple system atrophy with predominant parkinsonism and idiopathetic Parkinson diseases demonstrated by phase-corrected susceptibility-weighted imaging. Am J Neuroradiol. (2012) 33:266–73. doi: 10.3174/ajnr.A2765
102. Sako W, Murakami N, Izumi Y, Kaji R. The difference in putamen volume between {MSA} and PD: evidence from a meta-analysis. Parkinsonism Relat Disord. (2014) 20:873–7. doi: 10.1016/j.parkreldis.2014.04.028
103. Feng J, Huang B, Yang W, Zhang Y, Wang L, Wang L, et al. The putaminal abnormalities on 3.0T magnetic resonance imaging: can they separate parkinsonism-predominant multiple system atrophy from Parkinson's disease? Acta Radiol. (2014) 56:322–8. doi: 10.1177/0284185114524090
104. Wadia PM, Howard P, Ribeirro MQ, Robblee J, Asante A, Mikulis DJ, et al. The value of GRE, ADC and routine MRI in distinguishing parkinsonian disorders. Can J Neurol Sci. (2013) 40:389–402. doi: 10.1017/S0317167100014360
105. Focke NK, Helms G, Pantel PM, Scheewe S, Knauth M, Bachmann CG, et al. Differentiation of typical and atypical Parkinson syndromes by quantitative MR imaging. Am J Neuroradiol. (2011) 32:2087–92. doi: 10.3174/ajnr.A2865
106. Brenneis C, Seppi K, Schocke MF, Müller J, Luginger E, Bösch S, et al. Voxel-based morphometry detects cortical atrophy in the Parkinson variant of multiple system atrophy. Mov Disord. (2003) 18:1132–8. doi: 10.1002/mds.10502
107. Tir M, Delmaire C, le Thuc V, Duhamel A, Destée A, Pruvo JP, et al. Motor-related circuit dysfunction in MSA-P: usefulness of combined whole-brain imaging analysis. Mov Disord. (2009) 24:863–70. doi: 10.1002/mds.22463
108. Yang HG, Wang N, Luo XG, Lv H, Liu H, Li YM, et al. Cerebellar atrophy and its contribution to motor and cognitive performance in multiple system atrophy. NeuroImage Clin. (2019) 23:101891. doi: 10.1016/j.nicl.2019.101891
109. Krismer F, Seppi K, Göbel G, Steiger R, Zucal I, Boesch S, et al. Morphometric MRI profiles of multiple system atrophy variants and implications for differential diagnosis. Mov Disord. (2019) 34:1041–8. doi: 10.1002/mds.27669
110. Dash SK, Stezin A, Takalkar T, George L, Kamble NL, Netravathi M, et al. Abnormalities of white and grey matter in early multiple system atrophy: comparison of parkinsonian and cerebellar variants. Eur Radiol. (2019) 29:716–24. doi: 10.1007/s00330-018-5594-9
111. Fiorenzato E, Weis L, Seppi K, Onofrj M, Cortelli P, Zanigni S, et al. Brain structural profile of multiple system atrophy patients with cognitive impairment. J Neural Transm. (2017) 124:293–302. doi: 10.1007/s00702-016-1636-0
112. Kim H-J, Jeon BS, Kim YE, Kim J-Y, Kim YK, Sohn C-H, et al. Clinical and imaging characteristics of dementia in multiple system atrophy. Parkinsonism Relat Disord. (2013) 19:617–21. doi: 10.1016/j.parkreldis.2013.02.012
113. Barbagallo G, Sierra-Peña M, Nemmi F, Traon AP, Le, Meissner WG, Rascol O, et al. Multimodal MRI assessment of nigro-striatal pathway in multiple system atrophy and Parkinson disease. Mov Disord. (2016) 31:325–34. doi: 10.1002/mds.26471
114. Ito M, Watanabe H, Kawai Y, Atsuta N, Tanaka F, Naganawa S, et al. Usefulness of combined fractional anisotropy and apparent diffusion coefficient values for detection of involvement in multiple system atrophy. J Neurol Neurosurg Psychiatry. (2007) 78:722–8. doi: 10.1136/jnnp.2006.104075
115. Blain CR V, Barker GJ, Jarosz JM, Coyle NA, Landau S, Brown RG, et al. Measuring brain stem and cerebellar damage in parkinsonian syndromes using diffusion tensor MRI. Neurology. (2006) 67:2199–205. doi: 10.1212/01.wnl.0000249307.59950.f8
116. Pellecchia MT, Barone P, Mollica C, Salvatore E, Ianniciello M, Longo K, et al. Diffusion-weighted imaging in multiple system atrophy: a comparison between clinical subtypes. Mov Disord. (2009) 24:689–96. doi: 10.1002/mds.22440
117. Hara K, Watanabe H, Bagarinao E, Kawabata K, Yoneyama N, Ohdake R, et al. Corpus callosal involvement is correlated with cognitive impairment in multiple system atrophy. J Neurol. (2018) 265:2079–87. doi: 10.1007/s00415-018-8923-7
118. Ofori E, Krismer F, Burciu RG, Pasternak O, McCracken JL, Lewis MM, et al. Free water improves detection of changes in the substantia nigra in parkinsonism: A multisite study. Mov Disord. (2017) 32:1457–64. doi: 10.1002/mds.27100
119. Péran P, Barbagallo G, Nemmi F, Sierra M, Galitzky M, Traon AP Le, et al. MRI supervised and unsupervised classification of Parkinson's disease and multiple system atrophy. Mov Disord. (2018) 33:600–8. doi: 10.1002/mds.27307
120. Watanabe H, Fukatsu H, Katsuno M, Sugiura M, Hamada K, Okada Y, et al. Multiple regional 1H-MR spectroscopy in multiple system atrophy: NAA/Cr reduction in pontine base as a valuable diagnostic marker. J Neurol Neurosurg Psychiatry. (2004) 75:103–9.
121. Boxer AL, Geschwind MD, Belfor N, Gorno-Tempini ML, Schauer GF, Miller BL, et al. Patterns of brain atrophy that differentiate corticobasal degeneration syndrome from progressive supranuclear palsy. Arch Neurol. (2006) 63:81–6. doi: 10.1001/archneur.63.1.81
122. Kurata T, Kametaka S, Ohta Y, Morimoto N, Deguchi S, Deguchi K, et al. PSP as distinguished from CBD, MSA-P and PD by clinical and imaging differences at an early stage. Intern Med. (2011) 50:2775–81. doi: 10.2169/internalmedicine.50.5954
123. Josephs KA, Whitwell JL, Dickson DW, Boeve BF, Knopman DS, Petersen RC, et al. Voxel-based morphometry in autopsy proven PSP and CBD. Neurobiol Aging. (2008) 29:280–9. doi: 10.1016/j.neurobiolaging.2006.09.019
124. Price S, Paviour D, Scahill R, Stevens J, Rossor M, Lees A, et al. Voxel-based morphometry detects patterns of atrophy that help differentiate progressive supranuclear palsy and Parkinson's disease. NeuroImage. (2004) 23:663–9. doi: 10.1016/j.neuroimage.2004.06.013
125. Whitwell JL, Höglinger GU, Antonini A, Bordelon Y, Boxer AL, Colosimo C, et al. Radiological biomarkers for diagnosis in PSP: where are we and where do we need to be? MovDisord. (2017) 32:955–71. doi: 10.1002/mds.27038
126. Adachi M, Kawanami T, Ohshima H, Sugai Y, Hosoya T. Morning glory sign: a particular MR finding in progressive supranuclear palsy. Mag Reson Med Sci. (2004) 3:125–32. doi: 10.2463/mrms.3.125
127. Mueller C, Hussl A, Krismer F, Heim B, Mahlknecht P, Nocker M, et al. The diagnostic accuracy of the hummingbird and morning glory sign in patients with neurodegenerative parkinsonism. Parkinsonism Relat Disord. (2018) 54:90–4. doi: 10.1016/j.parkreldis.2018.04.005
128. Quattrone A, Nicoletti G, Messina D, Fera F, Condino F, Pugliese P, et al. MR imaging index for differentiation of progressive supranuclear palsy from Parkinson disease and the Parkinson variant of multiple system atrophy. Radiology. (2008) 246:214–21. doi: 10.1148/radiol.2453061703
129. Gröschel K, Hauser TK, Luft A, Patronas N, Dichgans J, Litvan I, et al. Magnetic resonance imaging-based volumetry differentiates progressive supranuclear palsy from corticobasal degeneration. NeuroImage. (2004) 21:714–24. doi: 10.1016/j.neuroimage.2003.09.070
130. Zanigni S, Evangelisti S, Testa C, Manners DN, Calandra-Buonaura G, Guarino M, et al. White matter and cortical changes in atypical parkinsonisms: a multimodal quantitative MR study. Parkinsonism Relat Disord. (2017) 39:44–51. doi: 10.1016/j.parkreldis.2017.03.001
131. Brenneis C, Seppi K, Schocke M, Benke T, Wenning GK, Poewe W. Voxel based morphometry reveals a distinct pattern of frontal atrophy in progressive supranuclear palsy. J Neurol Neurosurg Psychiatry. (2004) 75:246–9.
132. Padovani A, Borroni B, Brambati SM, Agosti C, Broli M, Alonso R, et al. Diffusion tensor imaging and voxel based morphometry study in early progressive supranuclear palsy. J Neurol Neurosurg Psychiatry. (2006) 77:457–63. doi: 10.1136/jnnp.2005.075713
133. Paviour DC, Price SL, Jahanshahi M, Lees AJ, Fox NC. Longitudinal MRI in progressive supranuclear palsy and multiple system atrophy: rates and regions of atrophy. Brain. (2006) 129:1040–9. doi: 10.1093/brain/awl021
134. Whitwell JL, Xu J, Mandrekar JN, Gunter JL, Jack CR, Josephs KA. Rates of brain atrophy and clinical decline over 6 and 12-month intervals in PSP: determining sample size for treatment trials. Parkinsonism Relat Disord. (2012) 18:252–6. doi: 10.1016/j.parkreldis.2011.10.013
135. Mueller K, Jech R, Bonnet C, Tintera J, Hanuška J, Möller HE, et al. Disease-specific regions outperform whole-brain approaches in identifying progressive supranuclear palsy: a multicentric MRI study. Front Neurosci. (2017) 11:100. doi: 10.3389/fnins.2017.00100
136. Kaasinen V, Kangassalo N, Gardberg M, Isotalo J, Karhu J, Parkkola R, et al. Midbrain-to-pons ratio in autopsy-confirmed progressive supranuclear palsy: replication in an independent cohort. Neurol Sci. (2015) 36:1251–3. doi: 10.1007/s10072-015-2184-3
137. Quattrone A, Morelli M, Nigro S, Quattrone A, Vescio B, Arabia G, et al. A new MR imaging index for differentiation of progressive supranuclear palsy-parkinsonism from Parkinson's disease. Parkinsonism Relat Disord. (2018) 54:3–8. doi: 10.1016/j.parkreldis.2018.07.016
138. Sakurai K, Tokumaru AM, Shimoji K, Murayama S, Kanemaru K, Morimoto S, et al. Beyond the midbrain atrophy: wide spectrum of structural MRI finding in cases of pathologically proven progressive supranuclear palsy. Neuroradiology. (2017) 59:431–43. doi: 10.1007/s00234-017-1812-4
139. Erbetta A, Mandelli ML, Savoiardo M, Grisoli M, Bizzi A, Soliveri P, et al. Diffusion tensor imaging shows different topographic involvement of the thalamus in progressive supranuclear palsy and corticobasal degeneration. Am J Neuroradiol. (2009) 30:1482–7. doi: 10.3174/ajnr.A1615
140. Kvickström P, Eriksson B, van Westen D, Lätt J, Elfgren C, Nilsson C. Selective frontal neurodegeneration of the inferior fronto-occipital fasciculus in progressive supranuclear palsy (PSP) demonstrated by diffusion tensor tractography. BMC Neurol. (2011) 11:13. doi: 10.1186/1471-2377-11-13
141. Reginold W, Lang AE, Marras C, Heyn C, Alharbi M, Mikulis DJ. Longitudinal quantitative MRI in multiple system atrophy and progressive supranuclear palsy. Parkinsonism Relat Disord. (2014) 20:222–5. doi: 10.1016/j.parkreldis.2013.10.002
142. Seppi K, Schocke MFH, Esterhammer R, Kremser C, Brenneis C, Mueller J, et al. Diffusion-weighted imaging discriminates progressive supranuclear palsy from PD, but not from the parkinson variant of multiple system atrophy. Neurology. (2003) 60:922–7. doi: 10.1212/01.WNL.0000049911.91657.9D
143. Spotorno N, Hall S, Irwin DJ, Rumetshofer T, Acosta-Cabronero J, Deik AF, et al. Diffusion tensor MRI to distinguish progressive supranuclear palsy from a-synucleinopathies. Radiology. (2019) 293:646–53. doi: 10.1148/radiol.2019190406
144. Pyatigorskaya N, Yahia-Cherif L, Gaurav R, Ewenczyk C, Gallea C, Valabregue R, et al. Multimodal magnetic resonance imaging quantification of brain changes in progressive supranuclear palsy. Mov Disord. (2019) 35:161–70.doi: 10.1002/mds.27877
145. Nicoletti G, Caligiuri ME, Cherubini A, Morelli M, Novellino F, Arabia G, et al. A fully automated, atlas-based approach for superior cerebellar peduncle evaluation in progressive supranuclear palsy phenotypes. Am J Neuroradiol. (2017) 38:523–30. doi: 10.3174/ajnr.A5048
146. Quattrone A, Caligiuri ME, Morelli M, Nigro S, Vescio B, Arabia G, et al. Imaging counterpart of postural instability and vertical ocular dysfunction in patients with PSP: a multimodal MRI study. Parkinsonism Relat Disord. (2019) 63:124–30. doi: 10.1016/j.parkreldis.2019.02.022
147. Talai AS, Sedlacik J, Boelmans K, Forkert ND. Widespread diffusion changes differentiate Parkinson's disease and progressive supranuclear palsy. Neuroimage Clin. (2018) 20:1037–43. doi: 10.1016/j.nicl.2018.09.028
148. Federico F, Simone IL, Lucivero V, De Mari M, Giannini P, Iliceto G, et al. Proton magnetic resonance spectroscopy in Parkinson's disease and progressive supranuclear palsy. J Neurol Neurosurg Psychiatry. (1997) 62:239–42. doi: 10.1136/jnnp.62.3.239
149. Negoro K, Tada Y, Ogasawara J, Kawai M, Morimatsu M, Hashida M, et al. Proton magnetic resonance spectroscopy in corticobasal degeneration and progressive supranuclear palsy. Geriatr Gerontol Int. (2004) 4:84–92. doi: 10.1111/j.1447-0594.2004.00124.x
150. Abe K, Terakawa H, Takanashi M, Watanabe Y, Tanaka H, Fujita N, et al. Proton magnetic resonance spectroscopy of patients with parkinsonism. Brain Res Bull. (2000) 52:589–95. doi: 10.1016/S0361-9230(00)00321-X
151. Barbagallo G, Morelli M, Quattrone A, Chiriaco C, Vaccaro MG, Gullà D, et al. In vivo evidence for decreased scyllo-inositol levels in the supplementary motor area of patients with progressive supranuclear palsy: a proton MR spectroscopy study. Parkinsonism Relat Disord. (2019) 62:185–91. doi: 10.1016/j.parkreldis.2018.12.008
152. Borroni B, Garibotto V, Agosti C, Brambati SM, Bellelli G, Gasparotti R, et al. White matter changes in corticobasal degeneration syndrome and correlation with limb apraxia. Arch Neurol. (2008) 65:796–801. doi: 10.1001/archneur.65.6.796
153. Yu F, Barron DS, Tantiwongkosi B, Fox P. Patterns of gray matter atrophy in atypical parkinsonism syndromes: a VBM meta-analysis. Brain Behav. (2015) 5:e00329. doi: 10.1002/brb3.329
154. Josephs K a, Tang-Wai DF, Edland SD, Knopman DS, Dickson DW, Parisi JE, et al. Correlation between antemortem magnetic resonance imaging findings and pathologically confirmed corticobasal degeneration. Arch Neurol. (2004) 61:1881–4. doi: 10.1001/archneur.61.12.1881
155. Whitwell JL, Jack CR, Boeve BF, Parisi JE, Ahlskog JE, Drubach DA, et al. Imaging correlates of pathology in corticobasal syndrome. Neurology. (2010) 75:1879–87. doi: 10.1212/WNL.0b013e3181feb2e8
156. Schofield EC, Caine D, Kril JJ, Cordato NJ, Halliday GM. Staging disease severity in movement disorder tauopathies: brain atrophy separates progressive supranuclear palsy from corticobasal degeneration. Mov Disord. (2005) 20:34–9. doi: 10.1002/mds.20286
157. Arakawa A, Saito Y, Seki T, Mitsutake A, Sato T, Katsumata J, et al. Corticobasal degeneration with deep white matter lesion diagnosed by brain biopsy. Neuropathology. (2020) 40:287–94. doi: 10.1111/neup.12638
158. Whitwell JL, Schwarz CG, Reid RI, Kantarci K, Jack CR, Josephs KA. Diffusion tensor imaging comparison of progressive supranuclear palsy and corticobasal syndromes. Parkinsonism Relat Disord. (2014) 20:493–8. doi: 10.1016/j.parkreldis.2014.01.023
159. Tedeschi G, Litvan I, Bonavita S, Bertolino A, Lundbom N, Patronas NJ, et al. Proton magnetic resonance spectroscopic imaging in progressive supranuclear palsy, Parkinson's disease and corticobasal degeneration. Brain. (1997) 120:1541–52. doi: 10.1093/brain/120.9.1541
160. Hacker CD, Perlmutter JS, Criswell SR, Ances BM, Snyder AZ. Resting state functional connectivity of the striatum in Parkinson's disease. Brain. (2012) 135:3699–711. doi: 10.1093/brain/aws281
161. Kim YJ, Ichise M, Ballinger JR, Vines D, Erami SS, Tatschida T, et al. Combination of dopamine transporter and D2 receptor SPECT in the diagnostic evaluation of PD, MSA, and PSP. Mov Disord. (2002) 17:303–12. doi: 10.1002/mds.10042
162. Nurmi E, Ruottinen HM, Bergman J, Haaparanta M, Solin O, Sonninen P, et al. Rate of progression in Parkinson's disease: A 6-[18F]fluoro-L-dopa PET study. Mov Disord. (2001) 16:608–15. doi: 10.1002/mds.1139
163. Broussolle E, Dentresangle C, Landais P, Garcia-Larrea L, Pollak P, Croisile B, et al. The relation of putamen and caudate nucleus 18F-Dopa uptake to motor and cognitive performances in Parkinson's disease. J Neurol Sci. (1999) 166:141–51. doi: 10.1016/S0022-510X(99)00127-6
164. Sharman M, Valabregue R, Perlbarg V, Marrakchi-Kacem L, Vidailhet M, Benali H, et al. Parkinson's disease patients show reduced cortical-subcortical sensorimotor connectivity. Mov Disord. (2013) 28:447–54. doi: 10.1002/mds.25255
165. Szewczyk-Krolikowski K, Menke RAL, Rolinski M, Duff E, Salimi-Khorshidi G, Filippini N, et al. Functional connectivity in the basal ganglia network differentiates PD patients from controls. Neurology. (2014) 83:208–14. doi: 10.1212/WNL.0000000000000592
166. Helmich RC, Janssen MJR, Oyen WJG, Bloem BR, Toni I. Pallidal dysfunction drives a cerebellothalamic circuit into Parkinson tremor. Ann Neurol. (2011) 69:269–81. doi: 10.1002/ana.22361
167. Wang M, Jiang S, Yuan Y, Zhang L, Ding J, Wang J, et al. Alterations of functional and structural connectivity of freezing of gait in Parkinson's disease. J Neurol. (2016) 263:1583–92. doi: 10.1007/s00415-016-8174-4
168. Fling BW, Cohen RG, Mancini M, Nutt JG, Fair DA, Horak FB. Asymmetric pedunculopontine network connectivity in parkinsonian patients with freezing of gait. Brain. (2013) 136:2405–18. doi: 10.1093/brain/awt172
169. Chung SJ, Choi YH, Kwon H, Park YH, Yun HJ, Yoo HS, et al. Sleep disturbance may alter white matter and resting state functional connectivities in Parkinson's disease. Sleep. (2017) 40. doi: 10.1093/sleep/zsx009
170. Bejr-kasem H, Pagonabarraga J, Martínez-Horta S, Sampedro F, Marín-Lahoz J, Horta-Barba A, et al. Disruption of the default mode network and its intrinsic functional connectivity underlies minor hallucinations in Parkinson's disease. Mov Disord. (2019) 34:78–86. doi: 10.1002/mds.27557
171. Baggio HC, Abos A, Segura B, Campabadal A, Uribe C, Giraldo DM, et al. Cerebellar resting-state functional connectivity in Parkinson's disease and multiple system atrophy: characterization of abnormalities and potential for differential diagnosis at the single-patient level. Neuroimage Clin. (2019) 22:101720. doi: 10.1016/j.nicl.2019.101720
172. Yu F, Barron DS, Tantiwongkosi B, Fox M, Fox P. Characterisation of meta-analytical functional connectivity in progressive supranuclear palsy. Clin Radiol. (2018) 73:415.e1-7. doi: 10.1016/j.crad.2017.11.007
173. Brown JA, Hua AY, Trujllo A, Attygalle S, Binney RJ, Spina S, et al. Advancing functional dysconnectivity and atrophy in progressive supranuclear palsy. Neuroimage Clin. (2017) 16:564–74. doi: 10.1016/j.nicl.2017.09.008
174. Ballarini T, Albrecht F, Mueller K, Jech R, Diehl-Schmid J, Fliessbach K, et al. Disentangling brain functional network remodeling in corticobasal syndrome – a multimodal MRI study. Neuroimage Clin. (2020) 25:102112. doi: 10.1016/j.nicl.2019.102112
175. Upadhyay N, Suppa A, Piattella MC, Giannì C, Bologna M, Di Stasio F, et al. Functional disconnection of thalamic and cerebellar dentate nucleus networks in progressive supranuclear palsy and corticobasal syndrome. Parkinsonism Relat Disord. (2017) 39:52–57. doi: 10.1016/j.parkreldis.2017.03.008
176. Burciu RG, Chung JW, Shukla P, Ofori E, Li H, McFarland NR, et al. Functional MRI of disease progression in Parkinson disease and atypical parkinsonian syndromes. Neurology. (2016) 87:709–17. doi: 10.1212/WNL.0000000000002985
177. Esposito F, Tessitore A, Giordano A, De Micco R, Paccone A, Conforti R, et al. Rhythm-specific modulation of the sensorimotor network in drug-naïve patients with Parkinson's disease by levodopa. Brain. (2013) 136:710–25. doi: 10.1093/brain/awt007
178. Chou YH, You H, Wang H, Zhao YP, Hou B, Chen NK, et al. Effect of repetitive transcranial magnetic stimulation on fMRI resting-state connectivity in multiple system atrophy. Brain Connect. (2015) 5:451–9. doi: 10.1089/brain.2014.0325
179. Gaenslen A, Unmuth B, Godau J, Liepelt I, Di Santo A, Schweitzer KJ, et al. The specificity and sensitivity of transcranial ultrasound in the differential diagnosis of Parkinson's disease: a prospective blinded study. Lancet Neurol. (2008) 7:417–24. doi: 10.1016/S1474-4422(08)70067-X
180. Li DH, He YC, Liu J, Chen SD. Diagnostic accuracy of transcranial sonography of the substantia nigra in Parkinson's disease: a systematic review and meta-analysis. Sci Rep. (2016) 6:20863. doi: 10.1038/srep20863
181. Berg D, Siefker C, Becker G. Echogenicity of the substantia nigra in Parkinson's disease and its relation to clinical findings. J Neurol. (2001) 248:684–9. doi: 10.1007/s004150170114
182. Richter D, Woitalla D, Muhlack S, Gold R, Tönges L, Krogias C. Brainstem raphe alterations in TCS: a biomarker for depression and apathy in Parkinson's disease patients. Front Neurol. (2018) 9:645. doi: 10.3389/fneur.2018.00645
183. Barrett MJ, Hagenah J, Dhawan V, Peng S, Stanley K, Raymond D, et al. Transcranial sonography and functional imaging in glucocerebrosidase mutation Parkinson disease. Parkinsonism Relat Disord. (2013) 19:186–91. doi: 10.1016/j.parkreldis.2012.09.007
184. Schweitzer KJ, Behnke S, Liepelt I, Wolf B, Grosser C, Godau J, et al. Cross-sectional study discloses a positive family history for Parkinson's disease and male gender as epidemiological risk factors for substantia nigra hyperechogenicity. J Neural Transm. (2007) 114:1167–71. doi: 10.1007/s00702-007-0725-5
185. Berg D, Merz B, Reiners K, Naumann M, Becker G. Five-year follow-up study of hyperechogenicity of the substantia nigra in Parkinson's disease. Mov Disord. (2005) 20:383–5. doi: 10.1002/mds.20311
186. Becker G, Seufert J, Bogdahn U, Reichmann H, Reiners K. Degeneration of substantia nigra in chronic Parkinson's disease visualized by transcranial color-coded real-time sonography. Neurology. (1995) 45:182–4. doi: 10.1212/WNL.45.1.182
187. Prati P, Bignamini A, Coppo L, Naldi A, Comi C, Cantello R, et al. The measuring of substantia nigra hyperechogenicity in an Italian cohort of Parkinson disease patients: a case/control study (NOBIS Study). J Neural Transm. (2017) 124:869–9. doi: 10.1007/s00702-017-1724-9
188. Behnke S, Berg D, Naumann M, Becker G. Differentiation of Parkinson's disease and atypical parkinsonian syndromes by transcranial ultrasound. J Neurol Neurosurg Psychiatry. (2005) 76:423–5. doi: 10.1136/jnnp.2004.049221
189. Spiegel J, Hellwig D, Möllers MO, Behnke S, Jost W, Fassbender K, et al. Transcranial sonography and [123I]FP-CIT SPECT disclose complementary aspects of Parkinson's disease. Brain. (2006) 129:1188–93. doi: 10.1093/brain/awl042
190. Berg D, Becker G, Zeiler B, Tucha O, Hofmann E, Preier M, et al. Vulnerability of the nigrostriatal system as detected by transcranial ultrasound. Neurology. (1999) 53:1026–31. doi: 10.1212/WNL.53.5.1026
191. Cardaioli G, Ripandelli F, Paolini Paoletti F, Nigro P, Simoni S, Brahimi E, et al. Substantia nigra hyperechogenicity in essential tremor and Parkinson's disease: a longitudinal study. Eur J Neurol. (2019) 26:1370–6. doi: 10.1111/ene.13988
192. Walter U, Niehaus L, Probst T, Benecke R, Meyer BU, Dressler D. Brain parenchyma sonography discriminates Parkinson's disease and atypical parkinsonian syndromes. Neurology. (2003) 60:74–7. doi: 10.1212/WNL.60.1.74
193. Walter U, Dressler D, Wolters A, Wittstock M, Greim B, Benecke R. Sonographic discrimination of dementia with Lewy bodies and Parkinson's disease with dementia. J Neurol. (2006) 253:448–54. doi: 10.1007/s00415-005-0023-9
194. Ebentheuer J, Canelo M, Trautmann E, Trenkwalder C. Substantia nigra echogenicity in progressive supranuclear palsy. Mov Disord. (2010) 25:773–7. doi: 10.1002/mds.22981
195. Sadowski K, Serafin-Król M, Szlachta K, Friedman A. Basal ganglia echogenicity in tauopathies. J Neural Transm. (2014) 122:863–5. doi: 10.1007/s00702-014-1310-3
196. Walter U, Dressler D, Wolters A, Probst T, Grossmann A, Benecke R. Sonographic discrimination of corticobasal degeneration vs progressive supranuclear palsy. Neurology. (2004) 63:504–9. doi: 10.1212/01.WNL.0000133006.17909.32
197. Walter U, Dressler D, Probst T, Wolters A, Abu-Mugheisib M, Wittstock M, et al. Transcranial brain sonography findings in discriminating between parkinsonism and idiopathic parkinson disease. Arch Neurol. (2007) 64:1635–40. doi: 10.1001/archneur.64.11.1635
198. Djang DSW, Janssen MJR, Bohnen N, Booij J, Henderson TA, Herholz K, et al. SNM practice guideline for dopamine transporter imaging with 123I-Ioflupane SPECT 1.0. J Nuclear Med. (2012) 53:154–63. doi: 10.2967/jnumed.111.100784
199. Catafau AM, Tolosa E, Laloux P, Vander Borght T, Van Zandijcke M, De Geeter F, et al. Impact of dopamine transporter SPECT using 123I-Ioflupane on diagnosis and management of patients with clinically uncertain parkinsonian syndromes. Mov Disord. (2004) 19:1175–82. doi: 10.1002/mds.20112
200. Plotkin M, Amthauer H, Klaffke S, Kühn A, Lüdemann L, Arnold G, et al. Combined 123I-FP-CIT and 123I-IBZM SPECT for the diagnosis of parkinsonian syndromes: study on 72 patients *. J Neural Transm. (2005) 112:677–92. doi: 10.1007/s00702-004-0208-x
201. Politis M. Neuroimaging in Parkinson disease: from research setting to clinical practice. Nat Rev Neurol. (2014) 10:708–22. doi: 10.1038/nrneurol.2014.205
202. Brücke T, Asenbaum S, Pirker W, Djamshidian S, Wenger S, Wöber C, et al. Measurement of the dopaminergic degeneration in Parkinson's disease with [123I] beta-CIT and SPECT. Correlation with clinical findings and comparison with multiple system atrophy and progressive supranuclear palsy. J Neural Transm Suppl. (1997) 50:9–24. doi: 10.1007/978-3-7091-6842-4_2
203. Klaffke S, Kuhn A a, Plotkin M, Amthauer H, Harnack D, Felix R, et al. Dopamine transporters, D2 receptors, and glucose metabolism in corticobasal degeneration. Mov Disord. (2006) 21:1724–7. doi: 10.1002/mds.21004
204. Im J-H, Chung SJ, Kim J-S, Lee MC. Differential patterns of dopamine transporter loss in the basal ganglia of progressive supranuclear palsy and Parkinson's disease: analysis with [(123)I]IPT single photon emission computed tomography. J Neurol Sci. (2006) 244:103–9. doi: 10.1016/j.jns.2006.01.006
205. Fazio P, Svenningsson P, Forsberg A, Jönsson EG, Amini N, Nakao R, et al. Quantitative analysis of 18F-(E)-N-(3-iodoprop-2-enyl)-2β-carbofluoroethoxy-3β-(4'-methyl-phenyl) nortropane binding to the dopamine transporter in Parkinson disease. J Nuclear Med. (2015) 56:714–20. doi: 10.2967/jnumed.114.152421
206. Vlaar AMM, van Kroonenburgh MJPG, Kessels AGH, Weber WEJ. Meta-analysis of the literature on diagnostic accuracy of SPECT in parkinsonian syndromes. BMC Neurol. (2007) 7:27. doi: 10.1186/1471-2377-7-27
207. Del Sole A, Perini G, Lecchi M, Mariani C, Lucignani G, Clerici F. Correlation between 123I-FP-CIT brain SPECT and parkinsonism in dementia with lewy bodies: caveat for clinical use. Clin Nuclear Med. (2015) 40:32–5. doi: 10.1097/RLU.0000000000000602
208. Spiegel J, Möllers MO, Jost WH, Fuss G, Samnick S, Dillmann U, et al. FP-CIT and MIBG scintigraphy in early Parkinson's disease. Mov Disord. (2005) 20:552–61. doi: 10.1002/mds.20369
209. Benamer HTS, Patterson J, Wyper DJ, Hadley DM, Macphee GJA, Grosset DG. Correlation of Parkinson's disease severity and duration with 123I-FP-CIT SPECT striatal uptake. Mov Disord. (2000) 15:692–8. doi: 10.1002/1531-8257(200007)15:4&<;692::AID-MDS1014&>;3.0.CO;2-V
210. O'Brien JT, Colloby S, Fenwick J, Williams ED, Firbank M, Burn D, et al. Dopamine transporter loss visualized with FP-CIT SPECT in the differential diagnosis of dementia with lewy bodies. Arch Neurol. (2004) 61:919–25. doi: 10.1001/archneur.61.6.919
211. Walker Z, Costa DC, Walker RWH, Shaw K, Gacinovic S, Stevens T, et al. Differentiation of dementia with lewy bodies from Alzheimer's disease using a dopaminergic presynaptic ligand. J Neurol Neurosurg Psychiatry. (2002) 73:134–40. doi: 10.1136/jnnp.73.2.134
212. Bäckström D, Granåsen G, Domellöf ME, Linder J, Mo SJ, Riklund K, et al. Early predictors of mortality in parkinsonism and Parkinson disease a population-based study. Neurology. (2018) 91:e2045–56. doi: 10.1212/WNL.0000000000006576
213. Jin S, Oh M, Oh SJ, Oh JS, Lee SJ, Chung SJ, et al. Differential diagnosis of parkinsonism using dual-phase F-18 FP-CIT PET imaging. Nuclear Med Mol Imaging. (2013) 47:44–51. doi: 10.1007/s13139-012-0182-4
214. Lee CS, Samii A, Sossi V, Ruth TJ, Schulzer M, Holden JE, et al. In vivo positron emission tomographic evidence for compensatory changes in presynaptic dopaminergic nerve terminals in Parkinson's disease. Ann Neurol. (2000) 47:493–503. doi: 10.1002/1531-8249(200004)47:4&<;493::AID-ANA13&>;3.0.CO;2-4
215. Okamura N, Villemagne VL, Drago J, Pejoska S, Dhamija RK, Mulligan RS, et al. In vivo measurement of vesicular monoamine transporter type 2 density in Parkinson disease with (18)F-AV-133. J Nucl Med. (2010) 51:223–8. doi: 10.2967/jnumed.109.070094
216. Erro R, Schneider S a, Quinn NP, Bhatia KP. What do patients with scans without evidence of dopaminergic deficit (SWEDD) have? New evidence and continuing controversies. J Neurol Neurosurg Psychiatry. (2015) 87:1–5. doi: 10.1136/jnnp-2014-310256
217. Nandhagopal R, Mak E, Schulzer M, McKenzie J, McCormick S, Sossi V, et al. Progression of dopaminergic dysfunction in a LRRK2 kindred: a multitracer PET study. Neurology. (2008) 71:1790–5. doi: 10.1212/01.wnl.0000335973.66333.58
218. Sossi V, De La Fuente-Fernández R, Nandhagopal R, Schulzer M, McKenzie J, Ruth TJ, et al. Dopamine turnover increases in asymptomatic LRRK2 mutations carriers. Mov Disord. (2010) 25:2717–23. doi: 10.1002/mds.23356
219. Papathanasiou ND, Boutsiadis A, Dickson J, Bomanji JB. Diagnostic accuracy of 123I-FP-CIT (DaTSCAN) in dementia with lewy bodies: a meta-analysis of published studies. Parkinsonism Relat Disord. (2012) 18:225–9. doi: 10.1016/j.parkreldis.2011.09.015
220. O'Brien JT, McKeith IG, Walker Z, Tatsch K, Booij J, Darcourt J, et al. Diagnostic accuracy of 123I-FP-CIT SPECT in possible dementia with lewy bodies. Br J Psychiatry. (2009) 194:34–39. doi: 10.1192/bjp.bp.108.052050
221. Walker Z, Jaros E, Walker RWH, Lee L, Costa DC, Livingston G, et al. Dementia with lewy bodies: a comparison of clinical diagnosis, FP-CIT single photon emission computed tomography imaging and autopsy. J Neurol Neurosurg Psychiatry. (2007) 78:1176–81. doi: 10.1136/jnnp.2006.110122
222. Brigo F, Turri G, Tinazzi M. 123I-FP-CIT SPECT in the differential diagnosis between dementia with lewy bodies and other dementias. J Neurol Sci. (2015) 359:161–71. doi: 10.1016/j.jns.2015.11.004
223. Thomas AJ, Attems J, Colloby SJ, O'Brien JT, Mckeith I, Walker R, et al. Autopsy validation of 123 I-FP-CIT dopaminergic neuroimaging for the diagnosis of DLB. Neurology. (2017) 88:276–83. doi: 10.1212/WNL.0000000000004254
224. Walker Z, Moreno E, Thomas A, Inglis F, Tabet N, Stevens T, et al. Evolution of clinical features in possible DLB depending on FP-CIT SPECT result. Neurology. (2016) 87:1045–51. doi: 10.1212/WNL.0000000000003076
225. Nocker M, Seppi K, Donnemiller E, Virgolini I, Wenning GK, Poewe W, et al. Progression of dopamine transporter decline in patients with the Parkinson variant of multiple system atrophy: a voxel-based analysis of [123I]β-CIT SPECT. Eur J Nuclear Med Mol Imaging. (2012) 39:1012–20. doi: 10.1007/s00259-012-2100-5
226. Cilia R, Rossi C, Frosini D, Volterrani D, Siri C, Pagni C, et al. Dopamine transporter spect imaging in corticobasal syndrome. PLoS ONE. (2011) 6:e18301. doi: 10.1371/journal.pone.0018301
227. Pirker S, Perju-Dumbrava L, Kovacs GG, Traub-Weidinger T, Pirker W. Progressive dopamine transporter binding loss in autopsy-confirmed corticobasal degeneration. J Parkinson's Dis. (2015) 5:907–12. doi: 10.3233/JPD-150625
228. Ling H, Kovacs GG, Vonsattel JPG, Davey K, Mok KY, Hardy J, et al. Astrogliopathy predominates the earliest stage of corticobasal degeneration pathology. Brain. (2016) 139:3237–52. doi: 10.1093/brain/aww256
229. Antonini A, Benti R, De Notaris R, Tesei S, Zecchinelli A, Sacilotto G, et al. 123I-Ioflupane/SPECT binding to striatal dopamine transporter (DAT) uptake in patients with Parkinson's disease, multiple system atrophy, and progressive supranuclear palsy. Neurol Sci. (2003) 24:149–50. doi: 10.1007/s10072-003-0103-5
230. Filippi L, Manni C, Pierantozzi M, Brusa L, Danieli R, Stanzione P, et al. 123I-FP-CIT in progressive supranuclear palsy and in Parkinson's disease: a SPECT semiquantitative study. Nuclear Med Commun. (2006) 27:381–6. doi: 10.1097/01.mnm.0000202858.45522.df
231. Kaasinen V, Kankare T, Joutsa J, Vahlberg T. Presynaptic striatal dopaminergic function in atypical parkinsonism: a metaanalysis of imaging studies. J Nucl Med. (2019) 60:1757–63. doi: 10.2967/jnumed.119.227140
232. Brooks DJ, Ibanez V, Sawle G V, Quinn N, Lees AJ, Mathias CJ, et al. Differing patterns of striatal 18F-dopa uptake in Parkinson's disease, multiple system atrophy, and progressive supranuclear palsy. Ann Neurol. (1990) 28:547–55. doi: 10.1002/ana.410280412
233. Ghaemi M, Hilker R, Rudolf J, Sobesky J, Heiss WD. Differentiating multiple system atrophy from Parkinson's disease: contribution of striatal and midbrain MRI volumetry and multi-tracer PET imaging. J Neurol Neurosurg Psychiatry. (2002) 73:517–23. doi: 10.1136/jnnp.73.5.517
234. Otsuka M, Ichiya Y, Hosokawa S, Kuwabara Y, Tahara T, Fukumura T, et al. Striatal blood flow, glucose metabolism and 18F-dopa uptake: difference in Parkinson's disease and atypical parkinsonism. J Neurol Neurosurg Psychiatry. (1991) 54:898–904. doi: 10.1136/jnnp.54.10.898
235. Li Y, Kang W, Yang Q, Zhang L, Zhang L, Dong F, et al. Predictive markers for early conversion of iRBD to neurodegenerative synucleinopathy diseases. Neurology. (2017) 88:1493–100. doi: 10.1212/WNL.0000000000003838
236. Postuma RB, Iranzo A, Hu M, Högl B, Boeve BF, Manni R, et al. Risk and predictors of dementia and parkinsonism in idiopathic REM sleep behaviour disorder: a multicentre study. Brain. (2019) 142:744–59. doi: 10.1093/brain/awz030
237. Antonini A, Schwarz J, Oertel WH, Beer HF, Madeja UD, Leenders KL. [11C]raclopride and positron emission tomography in previously untreated patients with Parkinson's disease: influence of L-dopa and lisuride therapy on striatal dopamine D2-receptors. Neurology. (1994) 44:1325–9. doi: 10.1212/WNL.44.7.1325
238. Rinne UK, Laihinen A, Rinne JO, Nagren K, Bergman J, Ruotsalainen U. Positron emission tomography demonstrates dopamine D2 receptor supersensitivity in the striatum of patients with early Parkinson's disease. Mov Disord. (1990) 5:55–59. doi: 10.1002/mds.870050114
239. Brooks DJ, Ibanez V, Sawle G V, Playford ED, Quinn N, Mathias CJ, et al. Striatal D2 receptor status in patients with Parkinson's disease, striatonigral degeneration, and progressive supranuclear palsy, measured with 11C-raclopride and positron emission tomography. Ann Neurol. (1992) 31:184–92. doi: 10.1002/ana.410310209
240. Ichise M, Kim YJ, Ballinger JR, Vines D, Erami SS, Tanaka F, et al. SPECT imaging of pre- and postsynaptic dopaminergic alterations in L-dopa-untreated PD. Neurology. (1999) 52:1206–14.
241. Antonini a, Leenders KL, Vontobel P, Maguire RP, Missimer J, Psylla M, et al. Complementary PET studies of striatal neuronal function in the differential diagnosis between multiple system atrophy and Parkinson's disease. Brain. (1997) 120 (Pt. 1):2187–95. doi: 10.1093/brain/120.12.2187
242. van Royen E, Verhoeff NF, Speelman JD, Wolters EC, Kuiper MA, Janssen AG. Multiple system atrophy and progressive supranuclear palsy. Diminished striatal D2 dopamine receptor activity demonstrated by 123I-IBZM single photon emission computed tomography. Arch Neurol. (1993) 50:513–16. doi: 10.1001/archneur.1993.00540050063017
243. Pirker S, Perju-Dumbrava L, Kovacs GG, Traub-Weidinger T, Asenbaum S, Pirker W. Dopamine D2 receptor SPECT in corticobasal syndrome and autopsy-confirmed corticobasal degeneration. Parkinsonism Relat Disord. (2013) 19:222–6. doi: 10.1016/j.parkreldis.2012.10.010
244. Van Laere K, Clerinx K, D'Hondt E, de Groot T, Vandenberghe W. Combined striatal binding and cerebral influx analysis of dynamic 11C-raclopride PET improves early differentiation between multiple-system atrophy and parkinson disease. J Nucl Med. (2010) 51:588–95. doi: 10.2967/jnumed.109.070144
245. Koch W, Hamann C, Radau PE, Tatsch K. Does combined imaging of the pre- and postsynaptic dopaminergic system increase the diagnostic accuracy in the differential diagnosis of parkinsonism? Eur J Nucl Med Mol Imag. (2007) 34:1265–73. doi: 10.1007/s00259-007-0375-8
246. Südmeyer M, Antke C, Zizek T, Beu M, Nikolaus S, Wojtecki L, et al. Diagnostic accuracy of combined FP-CIT, IBZM, and MIBG scintigraphy in the differential diagnosis of degenerative parkinsonism: a multidimensional statistical approach. J Nucl Med. (2011) 52:733–40. doi: 10.2967/jnumed.110.086959
247. Lobotesis K, Fenwick JD, Phipps a, Ryman a, Swann a, Ballard C, et al. Occipital hypoperfusion on SPECT in dementia with lewy bodies but not AD. Neurology. (2001) 56:643–9. doi: 10.1212/WNL.56.5.643
248. Rossi C, Volterrani D, Nicoletti V, Manca G, Frosini D, Kiferle L, et al. “Parkinson-dementia” diseases: a comparison by double tracer SPECT studies. Parkinsonism Relat Disord. (2009) 15:762–6. doi: 10.1016/j.parkreldis.2009.05.012
249. Antonini A, De Notaris R, Benti R, De Gaspari D, Pezzoli G. Perfusion ECD/SPECT in the characterization of cognitive deficits in Parkinson's disease. Neurol Sci. (2001) 22:45–6. doi: 10.1007/s100720170039
250. Misch MR, Mitchell S, Francis PL, Sherborn K, Meradje K, McNeely A a, et al. Differentiating between visual hallucination-free dementia with lewy bodies and corticobasal syndrome on the basis of neuropsychology and perfusion single-photon emission computed tomography. Alzheimer's Res Ther. (2014) 6:71. doi: 10.1186/s13195-014-0071-4
251. Zhang L, Murata Y, Ishida R, Saitoh Y, Mizusawa H, Shibuya H. Differentiating between progressive supranuclear palsy and corticobasal degeneration by brain perfusion spet. Nucl Med Commun. (2001) 22:767–72. doi: 10.1097/00006231-200107000-00007
252. Okuda B, Tachibana H, Kawabata K, Takeda M, Sugita M. Cerebral blood flow in corticobasal degeneration and progressive supranuclear palsy. Alzheimer Dis Assoc Disorders. (2000) 14:46–52. doi: 10.1097/00002093-200001000-00006
253. Takaya S, Sawamoto N, Okada T, Okubo G, Nishida S, Togashi K, et al. Differential diagnosis of parkinsonian syndromes using dopamine transporter and perfusion SPECT. Parkinsonism Relat Disord. (2018) 47:15–21. doi: 10.1016/j.parkreldis.2017.11.333
254. Song I-U, Yoo I, Chung Y-A, Jeong J. The value of brain perfusion SPECT for differentiation between mildly symptomatic idiopathic Parkinson's disease and the Parkinson variant of multiple system atrophy. Nucl Med Commun. (2015) 36:1049–54. doi: 10.1097/MNM.0000000000000354
255. Firbank MJ, Molloy S, McKeith IG, Burn DJ, O'Brien JT. Longitudinal change in 99mTcHMPAO cerebral perfusion SPECT in Parkinson's disease over one year. J Neurol Neurosurg Psychiatry. (2005) 76:1448–51. doi: 10.1136/jnnp.2004.058685
256. Matsui H, Udaka F, Miyoshi T, Hara N, Tamura A, Oda M, et al. Brain perfusion differences between Parkinson's disease and multiple system atrophy with predominant parkinsonian features. Parkinsonism Relat Disord. (2005) 11:227–32. doi: 10.1016/j.parkreldis.2005.01.001
257. Matsuda H, Imabayashi E, Kuji I, Seto A, Ito K, Kikuta D, et al. Evaluation of both perfusion and atrophy in multiple system atrophy of the cerebellar type using brain SPECT alone. BMC Med Imag. (2010) 10:17. doi: 10.1186/1471-2342-10-17
258. Sakamoto F, Shiraishi S, Tsuda N, Hashimoto M, Tomiguchi S, Ikeda M, et al. Diagnosis of dementia with lewy bodies: Can 123I-IMP and 123I-MIBG scintigraphy yield new core features? Br J Radiol. (2017) 90:20160156. doi: 10.1259/bjr.20160156
259. Eckert T, Barnes A, Dhawan V, Frucht S, Gordon MF, Feigin AS, et al. FDG PET in the differential diagnosis of parkinsonian disorders. Neuroimage. (2005) 26:912–21. doi: 10.1016/j.neuroimage.2005.03.012
260. Tripathi M, Dhawan V, Peng S, Kushwaha S, Batla A, Jaimini A, et al. Differential diagnosis of parkinsonian syndromes using F-18 fluorodeoxyglucose positron emission tomography. Neuroradiology. (2013) 55:483–92. doi: 10.1007/s00234-012-1132-7
261. Albrecht F, Ballarini T, Neumann J, Schroeter ML. FDG-PET hypometabolism is more sensitive than MRI atrophy in Parkinson's disease: a whole-brain multimodal imaging meta-analysis. Neuroimage Clin. (2019) 21:101594. doi: 10.1016/j.nicl.2018.11.004
262. Juh R, Kim J, Moon D, Choe B, Suh T. Different metabolic patterns analysis of parkinsonism on the 18F-FDG PET. Eur J Radiol. (2004) 51:223–33. doi: 10.1016/S0720-048X(03)00214-6
263. Zhao P, Zhang B, Gao S. 18F-FDG PET study on the idiopathic Parkinson's disease from several parkinsonian-plus syndromes. Parkinsonism Relat Disord. (2012) 18(Suppl. 1):S60–2. doi: 10.1016/S1353-8020(11)70020-7
264. Baudrexel S, Seifried C, Penndorf B, Klein JC, Middendorp M, Steinmetz H, et al. The value of putaminal diffusion imaging versus 18-fluorodeoxyglucose positron emission tomography for the differential diagnosis of the parkinson variant of multiple system atrophy. Mov Disord. (2014) 29:380–7. doi: 10.1002/mds.25749
265. Zalewski N, Botha H, Whitwell JL, Lowe V, Dickson DW, Josephs KA. FDG-PET in pathologically confirmed spontaneous 4R-tauopathy variants. J Neurol. (2014) 261:710–6. doi: 10.1007/s00415-014-7256-4
266. Botha H, Whitwell JL, Madhaven A, Senjem ML, Lowe V, Josephs KA. The pimple sign of progressive supranuclear palsy syndrome. Parkinsonism Relat Disord. (2014) 20:180–85. doi: 10.1016/j.parkreldis.2013.10.023
267. Niethammer M, Tang CC, Feigin A, Allen PJ, Heinen L, Hellwig S, et al. A disease-specific metabolic brain network associated with corticobasal degeneration. Brain. (2014) 137:3036–46. doi: 10.1093/brain/awu256
268. Hosaka K, Ishii K, Sakamoto S, Mori T, Sasaki M, Hirono N, et al. Voxel-based comparison of regional cerebral glucose metabolism between PSP and corticobasal degeneration. J Neurol Sci. (2002) 199:67–71. doi: 10.1016/S0022-510X(02)00102-8
269. Mosconi L, Tsui WH, Herholz K, Pupi A, Drzezga A, Lucignani G, et al. Multicenter standardized 18F-FDG PET diagnosis of mild cognitive impairment, Alzheimer's disease, and other dementias. J Nucl Med. (2008) 49:390–8. doi: 10.2967/jnumed.107.045385
270. Yong SW, Yoon JK, An YS, Lee PH. A comparison of cerebral glucose metabolism in Parkinson's disease, Parkinson's disease dementia and dementia with lewy bodies. Eur J Neurol. (2007) 14:1357–62. doi: 10.1111/j.1468-1331.2007.01977.x
271. Lim SM, Katsifis A, Villemagne VL, Best R, Jones G, Saling M, et al. The 18F-FDG PET cingulate island sign and comparison to 123I-beta-CIT SPECT for diagnosis of dementia with lewy bodies. J Nucl Med. (2009) 50:1638–45. doi: 10.2967/jnumed.109.065870
272. Hellwig S, Amtage F, Kreft A, Buchert R, Winz OH, Vach W, et al. [18F]FDG-PET is superior to [123I]IBZM-SPECT for the differential diagnosis of parkinsonism. Neurology. (2012) 79:1314–22. doi: 10.1212/WNL.0b013e31826c1b0a
273. Eidelberg D. Metabolic brain networks in neurodegenerative disorders: a functional imaging approach. Trends Neurosci. (2009) 32:548–7. doi: 10.1016/j.tins.2009.06.003
274. Huang C, Tang C, Feigin A, Lesser M, Ma Y, Pourfar M, et al. Changes in network activity with the progression of Parkinson's disease. Brain. (2007) 130:1834–46. doi: 10.1093/brain/awm086
275. Holtbernd F, Ma Y, Peng S, Schwartz F, Timmermann L, Kracht L, et al. Dopaminergic correlates of metabolic network activity in Parkinson's disease. Hum Brain Mapp. (2015) 36:3575–85. doi: 10.1002/hbm.22863
276. Wu P, Yu H, Peng S, Dauvilliers Y, Wang J, Ge J, et al. Consistent abnormalities in metabolic network activity in idiopathic rapid eye movement sleep behaviour disorder. Brain. (2014) 137:3122–8. doi: 10.1093/brain/awu290
277. Niethammer M, Eidelberg D. Metabolic brain networks in translational neurology: Concepts and applications. Ann Neurol. (2012) 72:635–47. doi: 10.1002/ana.23631
278. Huang C, Mattis P, Tang C, Perrine K, Carbon M, Eidelberg D. Metabolic brain networks associated with cognitive function in Parkinson's disease. Neuroimage. (2007) 34:714–23. doi: 10.1016/j.neuroimage.2006.09.003
279. Eckert T, Tang C, Ma Y, Brown N, Lin T, Frucht S, et al. Abnormal metabolic networks in atypical parkinsonism. Mov Disord. (2008) 23:727–33. doi: 10.1002/mds.21933
280. Shirvan J, Clement N, Ye R, Katz S, Schultz A, Johnson KA, et al. Neuropathologic correlates of amyloid and dopamine transporter imaging in lewy body disease. Neurology. (2019) 93:e476–84. doi: 10.1212/WNL.0000000000007855
281. Harding AJ, Halliday GM. Cortical lewy body pathology in the diagnosis of dementia. Acta Neuropathol. (2001) 102:355–63. doi: 10.1007/s004010100390
282. Irwin DJ, White MT, Toledo JB, Xie SX, Robinson JL, Van Deerlin V, et al. Neuropathologic substrates of Parkinson disease dementia. Ann Neurol. (2012) 72:587–98. doi: 10.1002/ana.23659
283. Edison P, Rowe CC, Rinne JO, Ng S, Ahmed I, Kemppainen N, et al. Amyloid load in Parkinson's disease dementia and lewy body dementia measured with [11C]PIB positron emission tomography. J Neurol Neurosurg Psychiatry. (2008) 79:1331–8. doi: 10.1136/jnnp.2007.127878
284. Donaghy P, Thomas AJ, O'Brien JT. Amyloid PET imaging in lewy body disorders. Am J Geriatr Psychiatry. (2015) 23:23–37. doi: 10.1016/j.jagp.2013.03.001
285. Foster ER, Campbell MC, Burack MA, Hartlein J, Flores HP, Cairns NJ, et al. Amyloid imaging of Lewy body-associated disorders. Mov Disord. (2010) 25:2516–23. doi: 10.1002/mds.23393
286. Gomperts SN, Locascio JJ, Marquie M, Santarlasci AL, Rentz DM, Maye J, et al. Brain amyloid and cognition in lewy body diseases. Mov Disord. (2012) 27:965–73. doi: 10.1002/mds.25048
287. Petrou M, Bohnen NI, Müller MLTM, Koeppe RA, Albin RL, Frey KA. Aβ-Amyloid deposition in patients with parkinson disease at risk for development of dementia. Neurology. (2012) 79:1161–7. doi: 10.1212/WNL.0b013e3182698d4a
288. Donaghy PC, Firbank MJ, Thomas AJ, Lloyd J, Petrides G, Barnett N, et al. Amyloid imaging and longitudinal clinical progression in dementia with lewy bodies. Am J Geriatr Psychiatry. (2020) 28:573–77. doi: 10.1016/j.jagp.2019.12.009
289. Shah N, Frey KA, Müller MLTM, Petrou M, Kotagal V, Koeppe RA, et al. Striatal and cortical β-amyloidopathy and cognition in Parkinson's disease. Mov Disord. (2016) 31:111–7. doi: 10.1002/mds.26369
290. Fagan AM, Mintun MA, Mach RH, Lee SY, Dence CS, Shah AR, et al. Inverse relation between in vivo amyloid imaging load and cerebrospinal fluid Abeta42 in humans. Ann Neurol. (2006) 59:512–9. doi: 10.1002/ana.20730
291. Maetzler W, Liepelt I, Reimold M, Reischl G, Solbach C, Becker C, et al. Cortical PIB binding in Lewy body disease is associated with Alzheimer-like characteristics. Neurobiol Dis. (2009) 34:107–12. doi: 10.1016/j.nbd.2008.12.008
292. Donaghy PC, Firbank MJ, Thomas AJ, Lloyd J, Petrides G, Barnett N, et al. Clinical and imaging correlates of amyloid deposition in dementia with lewy bodies. Mov Disord. (2018) 33:1130–8. doi: 10.1002/mds.27403
293. Claassen DO, Lowe VJ, Peller PJ, Petersen RC, Josephs KA. Amyloid and glucose imaging in dementia with lewy bodies and multiple systems atrophy. Parkinsonism Relat Disord. (2011) 17:160–5. doi: 10.1016/j.parkreldis.2010.12.006
294. Whitwell JL, Ahlskog JE, Tosakulwong N, Senjem ML, Spychalla AJ, Petersen RC, et al. Pittsburgh compound B and AV-1451 positron emission tomography assessment of molecular pathologies of Alzheimer's disease in progressive supranuclear palsy. Parkinsonism Relat Disord. (2018) 48:3–9. doi: 10.1016/j.parkreldis.2017.12.016
295. Villemagne VL, Fodero-Tavoletti MT, Masters CL, Rowe CC. Tau imaging: early progress and future directions. Lancet Neurol. (2015) 14:114–24. doi: 10.1016/S1474-4422(14)70252-2
296. Okamura N, Harada R, Ishiki A, Kikuchi A, Nakamura T, Kudo Y. The development and validation of tau PET tracers: current status and future directions. Clin Transl Imag. (2018) 6:305–16. doi: 10.1007/s40336-018-0290-y
297. Passamonti L, Rodríguez PV, Hong YT, Allinson KSJ, Williamson D, Borchert RJ, et al. 18F-AV-1451 positron emission tomography in Alzheimer's disease and progressive supranuclear palsy. Brain. (2017) 140:781–91. doi: 10.1093/brain/aww340
298. Cho H, Choi JY, Hwang MS, Lee SH, Ryu YH, Lee MS, et al. Subcortical (18) F-AV-1451 binding patterns in progressive supranuclear palsy. Mov Disord. (2016) 32:134–40. doi: 10.1002/mds.26844
299. Whitwell JL, Tosakulwong N, Schwarz CG, Botha H, Senjem ML, Spychalla AJ, et al. MRI outperforms [18F]AV-1451 PET as a longitudinal biomarker in progressive supranuclear palsy. Mov Disord. (2019) 34:105–13. doi: 10.1002/mds.27546
300. Whitwell JL, Lowe VJ, Tosakulwong N, Weigand SD, Senjem ML, Schwarz CG, et al. [18F]AV-1451 tau positron emission tomography in progressive supranuclear palsy. Mov Disord. (2017) 32:124–33. doi: 10.1002/mds.26834
301. Smith R, Schain M, Nilsson C, Strandberg O, Olsson T, Hägerström D, et al. Increased basal ganglia binding of (18) F-AV-1451 in patients with progressive supranuclear palsy. Mov Disord. (2016) 32:108–14. doi: 10.1002/mds.26813
302. Endo H, Shimada H, Sahara N, Ono M, Koga S, Kitamura S, et al. In vivo binding of a tau imaging probe, [(11) C]PBB3, in patients with progressive supranuclear palsy. Mov Disord. (2019) 34:744–54. doi: 10.1002/mds.27643
303. Kepe V, Bordelon Y, Boxer A, Huang SC, Liu J, Thiede FC, et al. PET imaging of neuropathology in tauopathies: progressive supranuclear palsy. J Alzheimer's Dis. (2013) 36:145–53. doi: 10.3233/JAD-130032
304. Schonhaut DR, McMillan CT, Spina S, Dickerson BC, Siderowf A, Devous MD, et al. 18F-flortaucipir tau positron emission tomography distinguishes established progressive supranuclear palsy from controls and parkinson disease: a multicenter study. Ann Neurol. (2017) 82:622–34. doi: 10.1002/ana.25060
305. Brendel M, Schönecker S, Höglinger G, Lindner S, Havla J, Blautzik J, et al. [18F]-THK5351 PET correlates with topology and symptom severity in progressive supranuclear palsy. Front Aging Neurosci. (2018) 9:440. doi: 10.3389/fnagi.2017.00440
306. Cho H, Baek MS, Choi JY, Lee SH, Kim JS, Ryu YH, et al 18F-AV-1451 binds to motor-related subcortical gray and white matter in corticobasal syndrome. Neurology. (2017) 89:1170–8. doi: 10.1212/WNL.0000000000004364
307. Smith R, Schöll M, Widner H, Van Westen D, Svenningsson P, Hägerström D, et al. In vivo retention of 18 F-AV-1451 in corticobasal syndrome. Neurology. (2017) 89:845–53. doi: 10.1212/WNL.0000000000004264
308. Marquié M, Normandin MD, Vanderburg CR, Costantino IM, Bien EA, Rycyna LG, et al. Validating novel tau positron emission tomography tracer [F-18]-AV-1451 (T807) on postmortem brain tissue. Ann Neurol. (2015) 78:787–800. doi: 10.1002/ana.24517
309. Lee SH, Cho H, Choi JY, Lee JH, Ryu YH, Lee MS, et al. Distinct patterns of amyloid-dependent tau accumulation in Lewy body diseases. Mov Disord. (2018) 33:262–72. doi: 10.1002/mds.27252
310. Hansen AK, Knudsen K, Lillethorup TP, Landau AM, Parbo P, Fedorova T, et al. In vivo imaging of neuromelanin in Parkinson's disease using 18F-AV-1451 PET. Brain. (2016) 139:2039–49. doi: 10.1093/brain/aww098
311. Coakeley S, Cho SS, Koshimori Y, Rusjan P, Ghadery C, Kim J, et al. [18F]AV-1451 binding to neuromelanin in the substantia nigra in PD and PSP. Brain Struct Funct. (2018) 223:589–95. doi: 10.1007/s00429-017-1507-y
312. Vermeiren C, Motte P, Viot D, Mairet-Coello G, Courade JP, Citron M, et al. The tau positron-emission tomography tracer AV-1451 binds with similar affinities to tau fibrils and monoamine oxidases. Mov Disord. (2018) 33:273–81. doi: 10.1002/mds.27271
313. Ng KP, Pascoal TA, Mathotaarachchi S, Therriault J, Kang MS, Shin M, et al. Monoamine oxidase B inhibitor, selegiline, reduces 18F-THK5351 uptake in the human brain. Alzheimer's Res Ther. (2017) 9:25. doi: 10.1186/s13195-017-0253-y
314. Ishiki A, Harada R, Kai H, Sato N, Totsune T, Tomita N, et al. Neuroimaging-pathological correlations of [(18)F]THK5351 PET in progressive supranuclear palsy. Acta Neuropathol Commun. (2018) 6:53. doi: 10.1186/s40478-018-0556-7
315. Ezura M, Kikuchi A, Ishiki A, Okamura N, Hasegawa T, Harada R, et al. Longitudinal changes in 18F-THK5351 positron emission tomography in corticobasal syndrome. Eur J Neurol. (2019) 26:1205–11. doi: 10.1111/ene.13966
316. Ono M, Sahara N, Kumata K, Ji B, Ni R, Koga S, et al. Distinct binding of PET ligands PBB3 and AV-1451 to tau fibril strains in neurodegenerative tauopathies. Brain. (2017) 140:764–80. doi: 10.1093/brain/aww339
317. Leuzy A, Chiotis K, Lemoine L, Gillberg PG, Almkvist O, Rodriguez-Vieitez E, et al. Tau PET imaging in neurodegenerative tauopathies—still a challenge. Mol Psychiatry. (2019) 24:1112–34. doi: 10.1038/s41380-018-0342-8
318. Perez-Soriano A, Arena JE, Dinelle K, Miao Q, McKenzie J, Neilson N, et al. PBB3 imaging in Parkinsonian disorders: evidence for binding to tau and other proteins. Mov Disord. (2017) 32:1016–24. doi: 10.1002/mds.27029
319. Eberling JL, Dave KD, Frasier MA. α-synuclein imaging: a critical need for Parkinson's disease research. J Parkinson's Dis. (2013) 3:565–7. doi: 10.3233/JPD-130247
320. Kotzbauer PT, Tu Z, Mach RH. Current status of the development of PET radiotracers for imaging alpha synuclein aggregates in Lewy bodies and Lewy neurites. Clin Transl Imag. (2017) 5:3–14. doi: 10.1007/s40336-016-0217-4
321. Shah M, Seibyl J, Cartier A, Bhatt R, Catafau AM. Molecular imaging insights into neurodegeneration: focus on α-synuclein radiotracers. J Nucl Med. (2014) 55:1397–400. doi: 10.2967/jnumed.113.136515
322. Hirsch EC, Hunot S. Neuroinflammation in Parkinson's disease: a target for neuroprotection? Lancet Neurol. (2009) 8:382–97. doi: 10.1016/S1474-4422(09)70062-6
323. Mizrahi R, Rusjan PM, Kennedy J, Pollock B, Mulsant B, Suridjan I, et al. Translocator protein (18 kDa) polymorphism (rs6971) explains in-vivo brain binding affinity of the PET radioligand [ 18F]-FEPPA. J Cereb Blood Flow Metab. (2012) 32:968–72. doi: 10.1038/jcbfm.2012.46
324. Gerhard A, Trender-Gerhard I, Turkheimer F, Quinn NP, Bhatia KP and Brooks DJ. In vivo imaging of microglial activation with [11C](R)?PK11195 PET in progressive supranuclear palsy. Mov. Disord. (2006) 21:89–93. doi: 10.1002/mds.20668
325. Ouchi Y, Yoshikawa E, Sekine Y, Futatsubashi M, Kanno T, Ogusu T, et al. Microglial activation and dopamine terminal loss in early Parkinson's disease. Ann Neurol. (2005) 57:168–75. doi: 10.1002/ana.20338
326. Ghadery C, Koshimori Y, Coakeley S, Harris M, Rusjan P, Kim J, et al. Microglial activation in Parkinson's disease using [18F]-FEPPA. J Neuroinflammation. (2017) 14:8. doi: 10.1186/s12974-016-0778-1
327. Ghadery C, Koshimori Y, Christopher L, Kim J, Rusjan P, Lang AE, et al. The interaction between neuroinflammation and β-amyloid in cognitive decline in Parkinson's disease. Mol Neurobiol. (2020) 57:492–501. doi: 10.1007/s12035-019-01714-6
328. Stokholm MG, Iranzo A, Østergaard K, Serradell M, Otto M, Bacher Svendsen K, Garrido A, et al. Extrastriatal monoaminergic dysfunction and enhanced microglial activation in idiopathic rapid eye movement sleep behaviour disorder. Neurobiol Dis. (2018) 115:9–16. doi: 10.1016/j.nbd.2018.02.017
329. Stokholm MG, Iranzo A, Østergaard K, Serradell M, Otto M, Svendsen KB, Garrido A, et al. Assessment of neuroinflammation in patients with idiopathic rapid-eye-movement sleep behaviour disorder: a case-control study. Lancet Neurol. (2017) 16:789–96. doi: 10.1016/S1474-4422(17)30173-4
330. Edison P, Ahmed I, Fan Z, Hinz R, Gelosa G, Ray Chaudhuri K, et al. Microglia, amyloid, and glucose metabolism in Parkinson's disease with and without dementia. Neuropsychopharmacology. (2013) 38:938–49. doi: 10.1038/npp.2012.255
331. Fan Z, Aman Y, Ahmed I, Chetelat G, Landeau B, Ray Chaudhuri K, et al. Influence of microglial activation on neuronal function in Alzheimer's and Parkinson's disease dementia. Alzheimer's Dement. (2015) 11:608–621.e7. doi: 10.1016/j.jalz.2014.06.016
332. Gerhard A, Banati RB, Goerres GB, Cagnin A, Myers R, Gunn RN, et al. [11C](R)-PK11195 PET imaging of microglial activation in multiple system atrophy. Neurology. (2003) 61:686–9. doi: 10.1212/01.WNL.0000078192.95645.E6
333. Passamonti L, Rodríguez PV, Hong YT, Allinson KSJ, Bevan-Jones WR, Williamson D, et al. PK11195 binding in Alzheimer disease and progressive supranuclear palsy. Neurology. (2018) 90:e1989–96. doi: 10.1212/WNL.0000000000005610
Keywords: biomarkers, Parkinson's disease (PD), atypical Parkinsonian syndromes, magnetic resonance imaging (MRI), single photon emission computed tomography (SPECT), diffusion-weighted imaging (DWI), transcranial sonography (TCS), positron emission tomography (PET)
Citation: Saeed U, Lang AE and Masellis M (2020) Neuroimaging Advances in Parkinson's Disease and Atypical Parkinsonian Syndromes. Front. Neurol. 11:572976. doi: 10.3389/fneur.2020.572976
Received: 15 June 2020; Accepted: 02 September 2020;
Published: 15 October 2020.
Edited by:
Yu Zhang, VA Palo Alto Health Care System, United StatesReviewed by:
Andrzej Friedman, Medical University of Warsaw, PolandJuan Carlos Martinez Castrillo, Ramón y Cajal University Hospital, Spain
José Luiz Pedroso, Federal University of São Paul, Brazil
Copyright © 2020 Saeed, Lang and Masellis. This is an open-access article distributed under the terms of the Creative Commons Attribution License (CC BY). The use, distribution or reproduction in other forums is permitted, provided the original author(s) and the copyright owner(s) are credited and that the original publication in this journal is cited, in accordance with accepted academic practice. No use, distribution or reproduction is permitted which does not comply with these terms.
*Correspondence: Mario Masellis, mario.masellis@sunnybrook.ca