


Abstract
This two-study article describes the development and evaluation of a multidimensional questionnaire based on the subjective aging construct Awareness of Age-Related Change (AARC). AARC captures the inherent multidimensionality and complexity of aging attitudes, which are strongly linked to indicators of successful aging, including health and well-being.
In Study 1, we generated a large item pool related to subjective aging experiences and then evaluated the psychometric properties of a 189-item version of the AARC questionnaire in a sample of 396 adults aged 40–95 years. Based on findings from Study 1, we retained the best-performing items and arrived at a more parsimonious 50-item version (AARC-50). In Study 2, the psychometric properties of the 50-item version were examined in an expanded sample of 424 adults ages 40–98.
Factor analyses in Study 1 indicated a two-factor structure of the questionnaire, representing the awareness of positive (AARC-Gains) and negative (AARC-Losses) age-related changes across five behavioral domains. Confirmatory factor analysis in Study 2 further supported this two-factor structure. In both studies, the AARC questionnaire demonstrated strong psychometric properties, including scale and item reliability, convergent and divergent validity, and predictive validity.
The availability of a reliable and valid assessment tool for measuring AARC-Gains and AARC-Losses allows researchers to capture detailed information about adults’ positive and negative self-perceptions of aging across multiple behavioral domains, which are instrumental for promoting successful aging.
It is well documented that subjective experiences of aging have significant and meaningful associations with a multitude of indicators of health and well-being throughout adulthood (Levy et al., 2002; Westerhof et al., 2014). This article describes the development and psychometric evaluation of a multidimensional questionnaire for assessing Awareness of Age-Related Change (AARC; Diehl & Wahl, 2010), a relatively new concept in the field of subjective aging, which is explicitly rooted in individuals’ behavioral experiences.
Advancing the Assessment of Subjective Aging
Adults’ subjective aging experiences have been conceptualized in various ways in the past several decades of research. In a comprehensive review of subjective aging concepts, Diehl and colleagues (2014) categorized existing approaches as follows: person-centered versus socio-centered; unidimensional versus multidimensional; and conscious versus preconscious. As described by Diehl and colleagues, commonly used subjective aging concepts include subjective age, age identity, self-perceptions of aging, and age stereotypes. Although these existing measures are predictive of relevant developmental outcomes (e.g., Kotter-Grühn, Kleinspehn-Ammerlahn, Gerstorf, & Smith, 2009; Sargent-Cox, Anstey, & Luszcz, 2012a; Wurm, Tomasik, & Tesch-Römer, 2010), there are some limitations with regard to their theoretical underpinnings. Therefore, we aim to advance the assessment of subjective aging by introducing the AARC questionnaire, which is deeply rooted in key tenets of life-span developmental theory, as a new approach to measuring adults’ subjective aging experiences. Diehl and Wahl (2010) defined AARC as, “all those experiences that make a person aware that his or her behavior, level of performance, or ways of experiencing his or her life have changed as a consequence of having grown older” (Diehl & Wahl, 2010, p. 340). AARC takes a new approach at the conceptual level in its focus on multidimensionality and multidirectionality, as well as on conscious self-perceptions about aging. These characteristics, in turn, lead to a novel measurement approach of subjective aging.
Capturing Multidimensionality and Multidirectionality
AARC draws on several key aspects of life-span developmental theory of adult development, including multidimensionality and multidirectionality (Baltes, Lindenberger, & Staudinger, 2006). AARC represents a multidimensional approach to subjective aging, as it focuses on five behavioral domains: health and physical functioning, cognitive functioning, interpersonal relations, social-cognitive and social-emotional functioning, and lifestyle and engagement. The relevance of these particular behavioral domains has been supported by data from a daily diary study (Miche et al., 2014).
Furthermore, despite theoretical and empirical evidence that gains and losses coexist in later life (e.g., Carstensen et al., 2011; Rothermund & Brandstädter, 2003), AARC is the first subjective aging construct which explicitly accounts for multidirectionality. That is, the AARC questionnaire was designed to acknowledge the possibility that both positive and negative age-related changes may occur simultaneously and in the same behavioral domain.
The aspects of multidimensionality and multidirectionality are currently underrepresented in existing subjective aging constructs. For instance, most previous measures of self-perceptions of aging have not taken into account that individuals’ experiences of aging may differ across different behavioral domains. A couple of notable exceptions are the AgeCog scales (Steverink, Westerhof, Bode, & Dittmann-Kohli, 2001) and the attitudes to aging questionnaire (Laidlaw, Power, & Schmidt, 2007). However, these measures do not explicitly address the issue of multidirectionality, in that they do not allow for the assessment of simultaneous gains and losses in the same behavioral domain.
Accessing Conscious Self-perceptions
Another novel aspect of AARC is its specific focus on individuals’ conscious self-perceptions of aging. Thus, by definition, AARC tries to capture a more self-reflective form of individuals’ views of their own aging. This also means that AARC represents a form of tacit knowledge that can be brought to explicit awareness when appropriate cues are provided (Diehl et al., 2014). This is in contrast to existing approaches that have relied on very brief (one to five items) measures (e.g., Kastenbaum, Derbin, Sabatini, & Artt, 1972; Lawton, 1975), which assess the experience of aging in very global ways and neglect to capture detailed information about individuals’ actual age-related experiences.
We expected that developing a tool to accurately assess AARC would allow for a more precise and nuanced assessment of self-perceptions of aging in middle-aged and older adults. Such a tool will help to further understand how self-perceptions may function as a psychological mechanism and which aspects of the self-perceptions are most relevant for later health and well-being, which is one of the pressing research questions in subjective aging research (Diehl et al., 2014; Levy, 2009). In fact, emerging work in this area already shows promise (Brothers, Miche, Wahl, & Diehl, 2017; Dutt, Gabrian, & Wahl, 2016). Furthermore, the ability to measure simultaneous positive and negative self-perceptions of aging across multiple behavioral domains has been very limited to date, but is also a pressing research question. Emerging evidence suggests that the positive and negative self-perceptions of aging function differently with regard to their associations with health and psychological well-being (Brothers, Gabrian, Wahl, & Diehl, 2016). Finally, because the subjective experience of growing older appears to be a relevant aspect of development throughout all of adulthood (e.g., Miche et al., 2014), we assume that the assessment of AARC in adults spanning a wide range of ages is essential.
Objectives
This article reports two studies describing the development and psychometric evaluation of a multidimensional self-report questionnaire for assessing AARC in middle-aged and older adults. The objectives of Study 1 were (a) to generate an exhaustive item pool for the development of a first, long version of the AARC questionnaire and (b) to evaluate the measurement structure and reliability in a sample of adults ages 40 and older. The objectives of Study 2 were (a) to shorten the AARC questionnaire to a more user-friendly length by retaining the best-performing items and (b) to examine the psychometric properties of this shorter form in an expanded sample of participants.
Study 1: Development and Psychometric Evaluation of a Long Version of the AARC Questionnaire
Study 1: Research Design and Methods
Questionnaire Development
We created a first, long version of the AARC questionnaire from which we could later select the best-performing items with regard to reliability and validity.
Item Pool Generation
To achieve content saturation (Nunnally & Bernstein, 1994) across the five behavioral domains, we started with the 50-items published in a German study on AARC (Wahl, Konieczny, & Diehl, 2013), which included both positive and negative items spanning all five behavioral domains. We then employed two separate qualitative approaches to generate additional items. The first qualitative approach involved analyzing open-ended reports collected in the context of a German daily diary study in which study participants described situations that made them aware of their age on a given day. Potential items were extracted and classified into the five behavioral domains, resulting in 49 new potential items (see Miche et al., 2014 for specific procedures for coding and classification).
The second qualitative approach was performed in the United States and involved conducting six focus group sessions, each with four to six middle-aged (ages 40–59; n = 14) or older adults (ages 60–90; n = 16). In these sessions, a group moderator asked participants to think about experiences from their recent past that made them realize they were growing older, including both positive and negative experiences. Participants’ responses were audio-recorded and transcribed verbatim.
Two raters then extracted statements from each of the six focus group transcripts using the following approach: (a) the statement was simplified to represent a single concept; (b) the statement was written so as to preserve the original meaning as much as possible; and (c) the statement could be widely understood and related to. For example, a participant reflected, “for me it’s been a change because I’ve lost a lot of weight…so I weigh 50 pounds less than I did when I was 30…I don’t eat as much junk food anymore. It doesn’t interest me. So that changes.” From this experience, the following statement was extracted as a potential questionnaire item: “I pay more attention to eating healthy food.” This example illustrates that the item refers a single idea: eating healthier food, rather than losing weight and eating healthier, which would have been a double-barreled item. Additionally, it can be seen that care was taken to preserve the original meaning as much as possible, while also reflecting a relatively general statement that most people should be able to understand and possibly relate to.
Two of the authors served as raters (A.B. and M.D.). Independently, they considered each potential item and classified it into one of the five behavioral domains and the two valences. For the example above about eating healthy food, this item was classified as Health and Physical Functioning/Positive. During this process, the raters closely followed the definition of the construct (Diehl & Wahl, 2010) to ensure that item content aligned with the meaning of AARC. This approach is in accordance with accepted procedures for measurement development, specifically for ensuring content validity (Pedhazur & Schmelkin, 1991). The raters first classified items individually, and then resolved any discrepancies during a consensus meeting. If consensus could not be reached, which happened with very few items, consultation with the other coauthors was sought. If disagreement remained, the potential item was dropped from the item pool.
In all, 90 new potential items were devised from the focus groups. These items were selected to supplement the content represented in the initial German questionnaire (50 items) or those extracted from the daily diary study (49 items). Adding the new items to those devised from previous research, we generated a 189-item version of the AARC questionnaire, including both positive and negative items across the five behavioral domains.
Scale Construction
The 189 items were compiled and distributed throughout the questionnaire in a predetermined pattern of alternating domains and valences (e.g., Health—positive, Cognitive—negative, Interpersonal—positive, etc). The stem for all items was generated in consultation with several experts in the area of self-perceptions of aging and the following wording was chosen: “With my increasing age, I realize that…” The item response format ranged from 1 (Not at all) to 5 (Very much).
Participants and Procedures for Data Collection
The resulting 189-item (AARC-189) questionnaire was administered to 396 community-residing adults, recruited from a mid-sized university town in the United States (age range: 40–98 years, M = 65.45 years, SD = 13.75 years). Participants reported above-average education (M = 16.80 years, SD = 2.67 years) and income (median gross annual income $70,000–$79,999) and rated their health as very good (M = 5.24, SD = 0.85; 6 = Excellent). Demographic characteristics of the sample are reported in Table 1. Eligibility criteria included that individuals were community-residing, free of memory complaints, and spoke English as their primary language.
Demographic Characteristics for the Two Study Samples
| Study 1 sample | Study 2 sample | |
|---|---|---|
| 189-item version (N = 396) | 50-item version (N = 424) | |
| Age (years), M (SD) | 65.45 (13.75) | 69.53 (12.52) |
| Range: 40–95 | Range: 42.15–98.49 | |
| Gender (% women) | 55.3% | 52.4% |
| Marital status | ||
| Single | 6.6% | 9.9% |
| Married/partnership | 62.9% | 55.9% |
| Separated/divorced | 18.0% | 17.0% |
| Widowed | 12.4% | 16.0% |
| Education (years), M (SD) | 16.81 (2.67) | 16.55 (2.72) |
| Degree | ||
| Less than high school | 1.0% | 0.2% |
| High school (GED) | 21.2% | 21.7% |
| Associates | 8.6% | 9.5% |
| Bachelors | 35.6% | 32.9% |
| Graduate degree | 33.6% | 33.9% |
| Race/ethnicity | ||
| White | 97.2% | 94.3% |
| American Indian | 0.3% | 0.2% |
| African American | 0.3% | 1.2% |
| Hispanic | 0.3% | 3.1% |
| Asian | 1.5% | 0.2% |
| Other | 0.5% | 0.9% |
| Employment status | ||
| Full-time | 31.2% | 23.2% |
| Part-time | 12.2% | 7.8% |
| Retired | 52.0% | 57.7% |
| Unemployed | 2.8% | 1.4% |
| Other | 1.8% | 9.9% |
| Household income | ||
| <$50 k | 31.9% | 35.6% |
| $50 k–$100 k | 36.7% | 35.9% |
| $100 k–$150 k | 16.6% | 16.6% |
| >$150 k | 14.8% | 12.5% |
| Self-rated health, M (SD) | 5.24 (0.85) | 5.20 (0.89) |
Note: Self-rated health ratings range from 1 (very poor) to 6 (very good). GED = general equivalency diploma.
Data were collected primarily by mail survey in which participants completed a self-report questionnaire packet including several measures of subjective aging. Fifty participants were selected at random to complete the questionnaire packet in the lab setting to evaluate the extent to which responses were consistent across in-home and in-lab settings. In addition to testing the effects of study location, we also tested for effects related to the order of administration by counterbalancing the order of the questionnaires as follows: (a) The order of items within the AARC questionnaire was reversed for a random half of the participants. (b) The order of the questionnaires within the packet was reversed for a random half of the participants. A 2 (test location) × 2 (questionnaire order) × 2 (item order) analysis of variance (ANOVA) showed that neither the test location, the order of items within the AARC questionnaire, nor the order of the questionnaires within the packet had a significant effect on the scale scores (all p’s > .05). The questionnaire packet took approximately 60–90 min to complete. Those who completed the questionnaires were eligible to win one of five small cash prizes ($20 each).
Study 1: Results
Measurement Structure
In accordance with accepted procedures for psychometric evaluation, we conducted exploratory factor analyses (EFA) and confirmatory factor analyses (CFA) with separate randomly generated halves of the sample (Anderson & Gerbing, 1988).
Exploratory Factor Analyses
To empirically test the behavioral domains theorized by Diehl and Wahl (2010), EFA was performed using the first random half of the sample (the calibration sample; n = 196). Given that a model in which 189 items entered simultaneously would not provide sufficient power (Tabachnick & Fidell, 2007), we relied on the theoretical foundation for our measure and entered the 10 behavioral domain scores (i.e., five scales with negative and five scales with positive domain-specific items) into a principal axis factor analyses. Promax rotation was performed to rotate the initial factor solution to simple structure (Table 2). The total amount of variance explained by this EFA was 68.23%. To determine how many factors to retain, we applied the criteria of Eigenvalue > 1.0 and the scree test (Tabachnick & Fidell, 2007). Two factors emerged: Factor 1 accounted for 47.54% and Factor 2 accounted for an additional 20.69% of the variance. Examining the pattern matrix, which shows the unique contribution of each variable to the factors, the five behavioral domains reflecting negative age-related changes loaded onto Factor 1, which we interpreted as Perceived Age-Related Losses. Conversely, the five behavioral domains reflecting positive age-related changes loaded onto Factor 2, which we interpreted as Perceived Age-Related Gains. Factor loadings ranged from 0.58 to 0.99. The two factors were moderately correlated (r = .40), supporting the choice of oblique rotation.
Principal Axis Factor Analyses Representing the First-Order Factor Structure of AARC
| Rotated factor loadings | Reliabilities | ||||
|---|---|---|---|---|---|
| Factor 1 “Losses” | Factor 2 “Gains” | Communalities | Cronbach’s α | Item-total correlations | |
| AARC subscales | |||||
| PHYS− | 0.88 | 0.72 | .90 | .23–.75 | |
| COG− | 0.80 | 0.64 | .92 | .43–.75 | |
| INT− | 0.73 | 0.59 | .79 | .11–.57 | |
| SC/SE− | 0.80 | 0.70 | .85 | .09–.63 | |
| LIFE− | 0.99 | 0.89 | .85 | .26–.66 | |
| PHYS+ | 0.58 | 0.30 | .84 | .33–.64 | |
| COG+ | 0.83 | 0.64 | .86 | .40–.64 | |
| INT+ | 0.73 | 0.70 | .88 | .25–.65 | |
| SC/SE+ | 0.95 | 0.88 | .89 | .15–.63 | |
| LIFE+ | 0.86 | 0.77 | .85 | .13–.66 | |
| Factor statistics | |||||
| Cronbach’s α | .91 | .88 | |||
| Item-total correlations | .76–.86 | .51–.88 | |||
| Eigenvalue | 4.75 | 2.07 | |||
| % Variance | 47.54 | 20.69 | |||
Note: PHYS = Health and Physical Functioning; COG = Cognitive Functioning; INT = Interpersonal Relations; SCSE = Social-Cognitive and Social-Emotional Functioning; LIFE = Lifestyle and Engagement. “+” positive domains; “−” = negative domains; AARC = Awareness of Age-Related Change. Oblique (Promax) rotation was applied. Results from the Pattern Matrix are reported. Analyses were performed using the calibration sample, a randomly selected half of the sample in Study 1 (N = 196).
Confirmatory Factor Analyses
We performed CFA with the cross-validation subsample (n = 200) to test the two-factor AARC structure that had emerged from the EFA. Analyses were performed using Mplus (Version 7). Following standard procedures for structural equation modeling, several different goodness of fit indices (GFI) were evaluated, including the chi-square statistic, the Comparative Fit Index (CFI), the Tucker–Lewis Index (TLI), the root mean square error of approximation (RMSEA), and the standard root mean square residual (SRMR). Criteria for acceptable model fit were as follows: CFI and TLI > 0.90, RMSEA < 0.08, and SRMR ≤ 0.05 (Byrne, 2012). Maximum likelihood estimation was used, as there were no major concerns regarding univariate or multivariate non-normality (absolute skewness and kurtosis values were all <1.0).
The hypothesized two-factor model of AARC, as illustrated in Figure 1, rested on the following assumptions: (a) A congeneric loading pattern in which the positive scale scores were expected to load on the AARC-Gains factor and negative scale scores were expected to load on the AARC-Losses factor; (b) the two factors were allowed to be correlated; and (c) error terms were uncorrelated. This model did not provide an acceptable fit to the data according to the GFI coefficients (see Panel A in Table 3). Modification indices suggested that the domain score error terms should be allowed to correlate (e.g., physical-positive with physical-negative, etc.), and adding this set of parameters was determined to be theoretically meaningful. Adding correlated error terms to the model resulted in a significant improvement in fit and a satisfactory overall fit to the data (see Panel A in Table 3).
Confirmatory Factor Analyses: Summary of Goodness of Fit Statistics
| χ2 | df | Δ χ2 | Δ df | Sig | CFI | TLI | RMSEA | SRMR | |
|---|---|---|---|---|---|---|---|---|---|
| Panel A | |||||||||
| Model results for Study 1 (189-item version) | |||||||||
| Baseline model: two-factor model of AARC | 134.02 | 34 | — | — | 0.00 | 0.93 | 0.91 | 0.12 | 0.07 |
| Two-factor model of AARC with domain score error terms correlated | 72.98 | 29 | 61.04a | 5 | 0.00 | 0.97 | 0.95 | 0.09 | 0.06 |
| Panel B | |||||||||
| Model results for Study 2 (50-item version) | |||||||||
| Baseline model: two-factor model of AARC | 99.67 | 34 | — | — | 0.00 | 0.97 | 0.96 | 0.07 | 0.04 |
| Two-factor model of AARC with domain score error terms correlated | 93.36 | 29 | 6.31 | 5 | 0.00 | 0.97 | 0.96 | 0.07 | 0.04 |
| Final two-factor model of AARC with Phys− correlated with other four losses domains | 51.11 | 30 | 48.56b | 4 | 0.00 | 0.99 | 0.99 | 0.04 | 0.03 |
Note: CFI = Comparative Fit Index; TLI = Tucker–Lewis Index; RMSEA = root mean square error of approximation; SRMR = square root mean residual; Phys− = AARC Physical Negative; Life− = AARC Lifestyle Negative.
aSignificantly better fit compared to the previous model, based on the chi-square critical value for the specified change in degrees of freedom, p < .05.
bSignificantly better fit compared to the baseline model, based on the chi-square critical value for the specified change in degrees of freedom, p < .05.
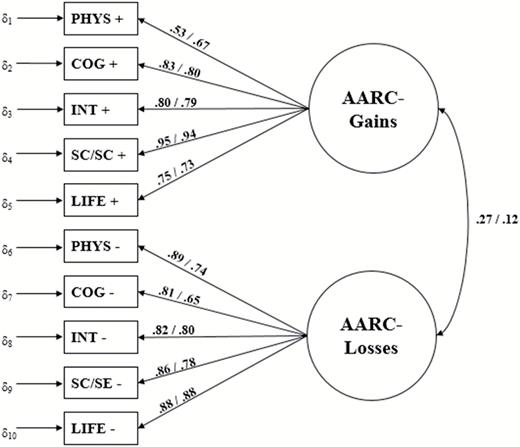
Measurement model of Awareness of Age-Related Change (AARC). Fully standardized coefficients from the final models are reported. The first number refers to the estimate for the 189-item version, whereas the second number is the estimate for the 50-item version. Arrows showing the correlated error terms are omitted for reasons of parsimony.
Item and Subscale Reliabilities
Based on the theoretical work guiding the measurement development process, we used unit-weighting to calculate sum scores for both positive and negative experiences in the five behavioral domains, as well as for the overarching gains and losses subscales (see left half of Table 4). Internal consistency reliability and item-total correlations (ITC) were calculated for both AARC-Gains and AARC-Losses, as well as the 10 theorized behavioral domains (see Table 2). Scale reliability coefficients ranged from α = .79 for the scale Interpersonal Relations–Negative to α = .92 for Cognitive Functioning–Negative and were satisfactory using an accepted cutoff of α > .70 (Nunnally & Bernstein, 1994). We used ITC to identify items that did not contribute sufficiently to their respective scale (e.g., ITC < .30) and targeted these items for later removal from the scale.
Descriptive Statistics and Reliability Statistics of the Questionnaire Subscales
| 189-item version (N = 396) | 50-item version (N = 424) | |||||||
|---|---|---|---|---|---|---|---|---|
| M (SD) | Range (possible range) | Cronbach’s α | ITCs (range) | M (SD) | Range (possible range) | Cronbach’s α | ITCs (range) | |
| Positive valence | ||||||||
| PHYS+ | 25.46 (7.01) | 9–43 (9–45) | .85 | .33–.72 | 15.39 (4.58) | 5–25 (5–25) | .81 | .44–.65 |
| COG+ | 40.74 (8.90) | 17–64 (14–70) | .88 | .42–.64 | 15.11 (4.13) | 5–25 (5–25) | .81 | .50–.66 |
| INT+ | 67.77 (13.02) | 28–100 (23–115) | .87 | .29–.65 | 15.97 (4.14) | 5–25 (5–25) | .75 | .29–.64 |
| SCSE+ | 88.10 (16.19) | 37–129 (28–140) | .89 | .15–.63 | 17.38 (4.54) | 5–25 (5–25) | .83 | .63–.68 |
| LIFE+ | 56.29 (11.28) | 23–85 (18–90) | .84 | .13–.65 | 15.70 (4.83) | 5–25 (5–25) | .81 | .53–.71 |
| AARC-Gains | 278.70 (48.36) | 126–405 (91–455) | .88 | .52–.88 | 79.60 (18.54) | 25–120 (25–125) | .89 | .63–.85 |
| Negative valence | ||||||||
| PHYS− | 64.38 (15.83) | 27–108 (24–120) | .90 | .23–.75 | 13.23 (4.61) | 5–25 (5–25) | .87 | .62–.76 |
| COG− | 39.56 (11.91) | 17–78 (17–85) | .92 | .43–.76 | 9.96 (3.62) | 5–25 (5–25) | .85 | .60–.74 |
| INT− | 39.99 (8.82) | 21–70 (19–95) | .79 | .11–.57 | 7.72 (3.00) | 5–21 (5–25) | .74 | .44–.57 |
| SCSE− | 50.51 (12.14) | 25–92 (23–115) | .86 | .09–.63 | 9.74 (3.57) | 5–22 (5–25) | .75 | .44–.67 |
| LIFE− | 33.81 (9.88) | 16–63 (15–75) | .85 | .26–.66 | 11.33 (4.09) | 5–25 (5–25) | .73 | .26–.64 |
| AARC-Losses | 228.43 (51.64) | 111–381 (98–490) | .92 | .78–.87 | 51.94 (15.62) | 25–111 (25–125) | .88 | .63–.84 |
Note: PHYS = Health and Physical Functioning; COG = Cognitive Functioning; INT = Interpersonal Relations; SCSE = Social-Cognitive and Social-Emotional Functioning; LIFE = Lifestyle and Engagement. “+” positive domains; “−” = negative domains. ITC = Item-total correlation. Item-level ITC data are available on request.
Study 2: Development and Psychometric Evaluation of a Shortened Version of the AARC Questionnaire
Study 2: Research Design and Methods
Scale Refinement and Reduction
The 189-item version of the questionnaire represented a promising start for the reliable assessment of adults’ awareness of age-related change, but the length of the questionnaire was problematic for research and applied purposes. Therefore, the AARC questionnaire underwent a rigorous evaluation to arrive at a shorter and more user-friendly version. The criteria for retaining items were specified a priori as follows: First, items were ordered by domain and valence in terms of the corrected ITC coefficients, marking items with an ITC of .30 or lower for removal, as recommended by Nunnally and Bernstein (1994). Second, Cronbach’s α was calculated for each behavioral domain, and for each item, the α was examined if the item was deleted. An item was marked for deletion if doing so would not decrease the scale reliability below an acceptable level (0.70). Third, we looked for potential areas of redundancy. If there were two very similar items, we dropped the item with the lower ITC. Throughout this entire process, we aimed to have an equal number of items for all domains and valences, resulting in five items per subscale and a total of 50 items, so as to allow for easily comparable scale scores. This iterative process represented a balance between empirical and substance-based reasoning to item selection. The previous item stem was retained.
Participants and Procedures for Data Collection
The 50-item version (AARC-50) questionnaire was tested with an expanded sample of 424 adults (age range: 42–98 years, M = 69.53 years, SD = 12.52 years). Approximately half of the sample (46.96%) were return participants from Study 1, tested approximately two and a half years later. Attrition analyses showed that, compared to the original sample, participants who returned for the second measurement occasion tended to be older by about 7 years, t(394) = 4.98, p < .001, and were slightly more educated, t(394) = 2.27, p = .024, and had a lower income, t(377) = −2.90, p = .004. There were no differences with regard to gender or health status of those who completed the second assessment. To augment the sample size and increase the demographic representation, additional participants were simultaneously recruited from a larger metropolitan area with the assistance of a private research company using a random-sampling procedure. Demographic characteristics were more diverse than the original sample in terms of education, income, and ethnicity (see Table 1).
For Study 2, participants were given the option to take the survey in pencil-and-paper format or online; about half of the participants selected the online version (50.9%). The questionnaire packet took approximately 30–45 min to complete, and those who completed it were entered into a drawing to win one of 10 cash prizes in the amount of $50 each.
Measures
Beyond the AARC-50 questionnaire and demographic information, we assessed four additional facets of subjective aging so as to allow empirical comparison of the AARC questionnaire with existing measures. We assessed subjective age with a single item in which participants indicated the age they felt most of the time (Kastenbaum et al., 1972). A proportional score was calculated ([Subjective Age − Chronological Age]/[Chronological Age]) to represent the extent to which a person’s subjective age differed from his or her chronological age (e.g., a score of −0.20 indicates that the person felt 20% younger than his or her chronological age; Rubin & Berntsen, 2006).
We measured attitudes toward own aging (ATOA) with the widely used five-item subscale from the Philadelphia Geriatric Center Morale Scale (PGCMS; Lawton, 1975). Individuals provided a dichotomous rating of their satisfaction with aging to questions such as, “Do things keep getting worse as you get older?” (Yes/No). Cronbach’s α in the present sample was satisfactory (α = .72).
The scales for aging-related cognitions (AgeCog scales; Steverink et al., 2001) were included to assess self-perceptions of aging in three domains: physical losses, social losses, and ongoing development. This 12-item scale includes four items per domain and its reliability and validity have been established (Wurm, Tesch-Römer, & Tomasik, 2007). The three scales demonstrated acceptable reliability in the current sample (Cronbach’s α = .57, .62, and .73, respectively).
Finally, domain-specific age stereotypes were assessed with the Views on Aging scale (Kornadt & Rothermund, 2011), which assesses perceptions of “old persons” in eight life domains, including personality, employment, and physical/mental fitness. An 8-point rating scale is shown between two opposing statements ranging from negative (1) to positive (8). For instance, in the family/partnership domain, respondents rate older adults on the following continuum, ranging from (1) “Old persons have many conflicts in their relationship with family” to (8) “Old persons have a harmonious relationship with their family.” Each domain has between three to five questions; mean scores were calculated for each domain. Reliability for each scale was satisfactory to good (Cronbach’s α ranged from .66 to .86).
Study 2: Results
Measurement Structure
We tested the two-factor Gains-Losses structure that was supported in Study 1 and followed the same set of analytic procedures for CFA. Testing the two-factor model resulted in acceptable fit (this time without specifying correlated error terms; see Panel B in Table 3). In a second step, according to the model misspecification indices, we added one more re-specification to allow the error term for the physical negative and lifestyle negative domains to be correlated. This change in model specification resulted in a good model fit compared to the baseline model, providing further support for the two-factor model of AARC.
Item and Scale Reliabilities
As in Study 1, unit-weighted sum scores were computed for each of the 10 behavioral domains, as well as the overarching gains and losses scale scores. The right half of Table 4 presents subscale metrics, as well as item and scale reliabilities. Cronbach’s α ranged from .73 to .89, indicating good reliability of the reduced subscales. Item-level reliabilities were also good overall, with most items exceeding the a priori cutoff of .30 (range = .26–.85).
Correlations between the subscales of the long and short versions of the questionnaire ranged from r = .82 to .98. The correlations between the factor scores for Gains and Losses derived from the two versions were .96 and .98, respectively, indicating that little to no substantive content was lost in the process of reducing the questionnaire length. Given that the factor analyses consistently supported a two-factor structure of the AARC questionnaire, and that the scale reliabilities were acceptable, the subsequent analyses were conducted with the overarching Gains and Losses scale scores.
Convergent and Divergent Validity
Examination of convergent and divergent validity showed that AARC-Losses was significantly correlated with other measures of subjective aging, such as felt age, ATOA, and the AgeCog scales (see Table 5). A more negative view of one’s own aging—such as feeling older than one’s age, being less satisfied with one’s aging process, and noticing more negative experiences—was significantly associated with AARC-Losses. AARC-Gains showed only a significant association with the ongoing development subscale of the AgeCog scales. Overall, the magnitude of the associations with the other measures of subjective aging tended to be significantly stronger for AARC-Losses compared to AARC-Gains, as tested using Fisher’s r-to-Z transformation (Lee & Preacher, 2013). We assessed divergent validity between AARC and evaluative age stereotypes, a conceptually different subjective aging construct. The eight domain-based stereotype scales showed a small degree of overlap, which indicated that age stereotypes and awareness of age-related change were distinct constructs.
Convergent and Divergent Validities for the 50-Item Version (N = 414)
| AARC-Gains | AARC-Losses | Fisher’s r-to-Z transformation | |
|---|---|---|---|
| Convergent validity | |||
| Felt age | −.10* | .28** | −2.83** |
| ATOA | .11* | −.67** | −10.43** |
| AgeCog—Ongoing Development | .22** | −.54** | −5.60** |
| AgeCog—Physical Decline | −.21** | .64** | −7.99** |
| AgeCog—Social Loss | −.12* | .51** | −6.61** |
| Divergent validity | |||
| Age Stereotype—Family and Partnership | .02 | −.31** | −4.56** |
| Age Stereotype—Friends and Acquaintances | .06 | −.29** | −3.61** |
| Age Stereotype—Religion and Spirituality | .22** | −.04 | 2.78** |
| Age Stereotype—Leisure/Civic Commitment | .16** | −.32** | −2.55* |
| Age Stereotype—Personality | .14** | −.26** | −1.88 |
| Age Stereotype—Financial Situation | .02 | −.26** | −3.73** |
| Age Stereotype—Employment | .21** | −.22** | −0.16 |
| Age Stereotype—Physical Fitness/Appearance | .18** | −.32** | −2.24* |
Note: AARC = Awareness of Age-Related Change. Felt age is coded such that a negative score indicates feeling younger (e.g., reflecting a more positive perception of aging).
*p < .05; **p < .01.
Discussion and Implications
AARC represents a relatively new approach to conceptualizing subjective aging, which aims to take into account the complex and multidimensional nature of experiencing aging. The findings presented here complement and build on a rich history of literature on subjective aging, including concepts such as age identity, views of aging, and age stereotypes (Barrett, 2003; Diehl et al., 2014; Kastenbaum et al., 1972; Levy, 2003). Building on the theoretical basis of AARC (Diehl & Wahl, 2010), this study provided evidence that AARC can be assessed in a psychometrically sound way with a new self-report questionnaire (see Supplementary Material for the AARC-50 questionnaire and scoring details).
A Novel Approach to Understanding and Assessing Subjective Aging
Availability of Domain-Specific Information
The AARC-50 questionnaire is a measure that reflects the multidimensional nature of subjective aging (Hummert, 2011), assessing adults’ positive and negative subjective aging experiences across five behavioral domains: Health and Physical Functioning; Cognitive Functioning; Interpersonal Relations; Social-Cognitive and Social-Emotional Functioning; and Lifestyle and Engagement (Diehl & Wahl, 2010). Although these five behavioral domains are not completely exhaustive, they capture those areas in adults’ daily lives that give rise to the majority of subjective aging experiences (Miche et al., 2014). Furthermore, empirical evidence from other research supports the utility of such a multidimensional approach to measuring AARC. For instance, we recently showed that the AARC domains predicted health and well-being over and above existing unidimensional measures of subjective aging (Brothers et al., 2017). Such evidence reflects growing support for taking a multidimensional approach to the study of subjective aging.
Assessment of Perceived Gains and Losses
Although some notable multidimensional measures of subjective aging (e.g., Laidlaw et al., 2007; Steverink et al., 2001) show promise and utility for a variety of uses, these measures do not allow for the simultaneous assessment of positive and negative aging experiences. Alternatively, AARC’s novel contribution is that both positive and negative aging experiences can be reported within the same behavioral domain. For instance, taking better care of one’s health while also experiencing more aches and pains reflect both positive and negative physical changes that can plausibly co-occur. Such an approach has been used to assess attitudes about others’ aging (see Levy, Kasl, & Gill, 2004) but was previously not available for assessing self-perceptions of aging. This gain–loss factor structure of AARC, which was empirically supported in this study, directly addresses the essential life-span developmental proposition that aging is characterized by both positive and negative development (Baltes, 1987; Heckhausen, Dixon, & Baltes, 1989). Furthermore, taking a gains–losses approach is consistent with previous research showing that individuals have expectations about aging that represent both positive and negative changes (Heckhausen & Baltes, 1991). The fact that these expectations shift increasingly toward losses after midlife (Baltes, 1987; Heckhausen et al., 1989) reiterates the importance of studying subjective aging across a wide range of ages.
The unique ability of the AARC-50 questionnaire to differentiate between perceived gains and losses is beneficial, given that gains and losses represent separate aspects of the perceived aging experience. Consistent with previous research, positive perceptions of aging appear to serve as a protective factor in aging, for instance in the face of a serious health condition (Wurm, Tomasik, & Tesch-Römer, 2008), whereas negative perceptions of aging are predictive of negative outcomes (Meisner, 2012). With regard to AARC itself, recent evidence also supports the differential functioning of AARC-Gains and AARC-Losses in that AARC-Gains (but not AARC-Losses) buffered against the detrimental effects of a limited future view on poorer well-being (Brothers et al., 2016).
Capturing Novel Subjective Aging Information
The convergent and divergent validity findings demonstrated that the AARC-50 questionnaire assesses a distinct subjective aging construct. AARC-Losses showed a moderate degree of empirical overlap (7.8%–44.9% shared variance) with subjective aging constructs that also capture perceptions of a person’s own aging process, for example, felt age, ATOA, and the AgeCog scales. However, that AARC-Gains shared only 1.0%–4.8% of the variance with the existing subjective aging constructs, is not entirely surprising, as existing subjective aging constructs are known to reflect primarily negative age-related experiences. This finding suggests that AARC-Gains primarily captures information that is not well-represented in existing measures of self-perceived aging, and deserves future research attention.
With regard to divergent validity, the associations between AARC and age stereotypes indicated a small degree of empirical overlap (0.04%–10.24% shared variance), suggesting that the AARC-50 questionnaire assesses adults’ self-perceptions of their own aging in a way that is distinct from the stereotypes they may hold about others’ aging in general. Overall, these findings further establish AARC as a distinct construct in the literature and are consistent with a study by Brothers and colleagues (2015), which also supported the distinctiveness of the AARC construct.
Limitations and Future Directions
One limitation of the current work is that both samples were racially/ethnically homogeneous, representing a White, overall healthy middle-class population from one geographical location in the Midwestern part of the United States. A second limitation is that approximately half of Study 2 participants completed the questionnaire 2.5 years earlier. Because they were sensitized to the questions, their responses may have been influenced as a result. Given these limitations, future work applying the scale to a more economically and racially diverse sample that has not yet been exposed to the questionnaire will be essential.
Further Development of the AARC Questionnaire
Despite this limitation, the availability of the new AARC-50 questionnaire opens the door for research to advance the current understanding of subjective aging. From a measurement standpoint, the AARC-50 questionnaire represents a transitional step in the process of scale development, and there are already several additional refinements underway. First, item response theory theory is being used to identify and select a small number of highly discriminatory items to develop a 10-item version of the AARC questionnaire (Kaspar, Gabrian, Brothers, Wahl, & Diehl, 2018). Although one advantage of the AARC-50 is its thorough assessment approach, we acknowledge that an ultra-short version will provide an even more parsimonious, yet reliable way to assess AARC-Gains and AARC-Losses in large-scale, epidemiological studies. Second, a German version of AARC has been developed in conjunction with the English version and shows equally strong psychometric properties (Brothers et al., 2016). The availability of a cross-culturally relevant assessment tool of subjective aging will allow for the examination of similarities and differences between middle-aged and older adults in the United States and Germany, a topic that has received some attention in the literature (Staudinger, 2015; Westerhof & Barrett, 2005). Recent data also support the short-term test–retest reliability of the AARC-50 questionnaire over a period of 2 weeks in a German sample. Third, it will be important to conduct qualitative interviews with respondents from a wide range of backgrounds with respect to race, socioeconomic status, gender, and age, so as to better understand thought patterns and possible misunderstandings of respondents as they complete the questionnaire.
Using the AARC Questionnaire in Research and Practice
There are several substantive areas of research that warrant further exploration. First, examining possible social, biological, and psychological antecedents and outcomes of AARC-Gains and AARC-Losses (Diehl & Wahl, 2010) will help to elucidate how awareness of age-related change is formed and how it influences developmental outcomes. For instance, psychological characteristics of interest include the awareness of remaining lifetime, personality traits, or coping and adaptation strategies in later life. Second, questions of the valence-specific information provided by AARC-Gains and AARC-Losses are a wide open area for research. Specifically, it is not yet known how perceived age-related gains and losses might interact to predict developmental outcomes, or whether there may be an optimal balance of AARC-Gains and AARC-Losses.
From a practical standpoint, the use of the AARC-50 questionnaire within applied settings also has a great deal of potential. For example, AARC may be used as a tool to identify individuals holding negative attitudes and experiences about growing older, which are well-known risk factors that can impede healthy and optimal aging (Westerhof et al., 2014). It can also be used to determine the extent to which programming and interventions are effective for promoting age-related gain experiences, even in the face of age-related losses, which is a desirable outcome for aging interventions (Diehl et al., 2015; Miche, Brothers, Diehl, & Wahl, 2015). Furthermore, because negative views of aging have been identified as a barrier to health promotion (e.g., Levy & Myers, 2004), the AARC questionnaire may be added to exercise or nutrition interventions to assess a program’s effect on adults’ self-perceptions of aging (Brothers & Diehl, in press). It should also be noted that, although the empirically derived two-factor structure of gains and losses emerged from the factor analyses, using adults’ scores from the 10 domain-specific subscales may be appropriate in applied contexts to gain a detailed understanding of individuals’ self-perceptions of aging. This approach can be justified given the theoretical support for the behavioral domains, as well as the acceptable reliability findings for each of the 10 subscales.
In summary, the findings reported here demonstrate that adults’ perceived age-related gains and losses can be assessed in a psychometrically sound way using the AARC questionnaire. This study builds on decades of research demonstrating the many connections between measures of subjective aging and health and well-being (e.g., Westerhof et al., 2014). As researchers have recently begun to examine longitudinal trends and underlying mechanisms to explain these associations (Kornadt & Rothermund, 2012; Kotter-Grühn, 2013; Sargent-Cox, Anstey, & Luszcz, 2012b), this theoretically grounded and psychometrically sound measurement instrument becomes a useful research tool, allowing for the advancement of knowledge regarding the complex associations between measures of subjective aging and developmental outcomes.
Funding
This work was supported by the National Institute on Aging, National Institutes of Health (R21 AG041379 to M.D., F31 AG051291 to A.B.) and the Alexander von Humboldt Foundation (M.D. and H.-W.W.).
Conflict of Interest
None reported.
Acknowledgments
We thank all of the participants for the time and effort they devoted to this study. This study was approved by the Colorado State University (CSU) Institutional Review Board (IRB) protocol #10-2080H. Informed consent was obtained from all participants in accordance with ethical standards for human subject research.

